| Red | Green | Blue | |
| z | 17.64 | ||
| znorm | Inf | ||
| sky | -Inf | -Inf | -Inf |
| S/N | 24.1 | 42.2 | 45.7 |
| S/N(c) | 0.0 | 0.0 | 0.0 |
| SN(E/C) |

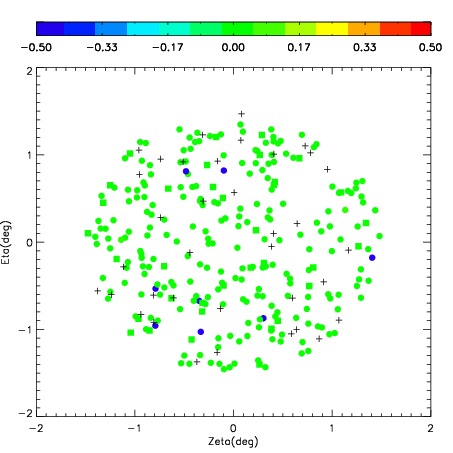

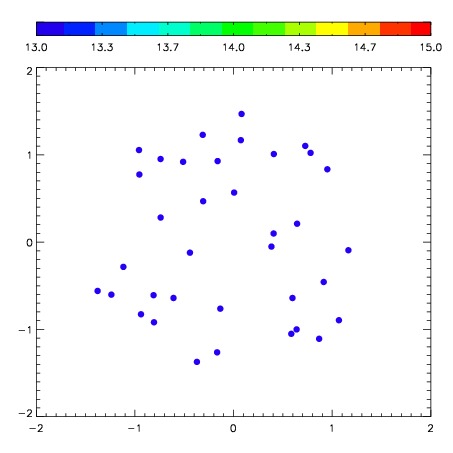
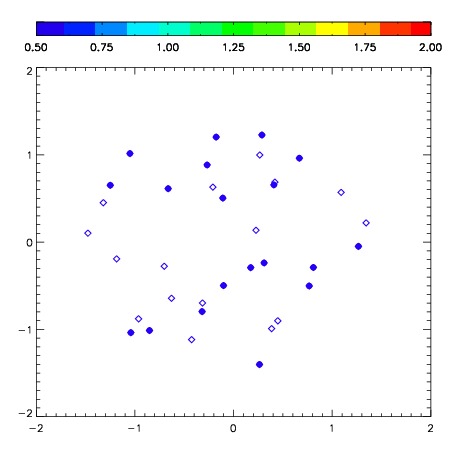
| Frame | Nreads | Zeropoints | Mag plots | Spatial mag deviation | Spatial sky 16325A emission deviations (filled: sky, open: star) | Spatial sky continuum emission | Spatial sky telluric CO2 absorption deviations (filled: H < 10) | |||||||||||||||||||||||
| 0 | 0 |
|
|
|
|
|
|
| IPAIR | NAME | SHIFT | NEWSHIFT | S/N | NAME | SHIFT | NEWSHIFT | S/N |
| 0 | 08430027 | 0.486766 | 0.00000 | 291.257 | 08430026 | 0.00000 | 0.486766 | 295.841 |
| 1 | 08430028 | 0.482076 | 0.00469002 | 297.840 | 08430033 | 0.0523942 | 0.434372 | 295.850 |
| 2 | 08430031 | 0.467271 | 0.0194950 | 285.652 | 08430029 | 0.0575934 | 0.429173 | 292.629 |
| 3 | 08430032 | 0.469631 | 0.0171350 | 280.736 | 08430030 | 0.0552108 | 0.431555 | 290.430 |