| Red | Green | Blue | |
| z | 17.64 | ||
| znorm | Inf | ||
| sky | -Inf | -Inf | -Inf |
| S/N | 22.9 | 38.3 | 42.5 |
| S/N(c) | 0.0 | 0.0 | 0.0 |
| SN(E/C) |

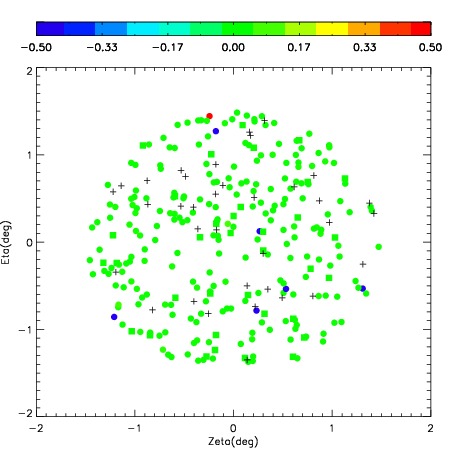
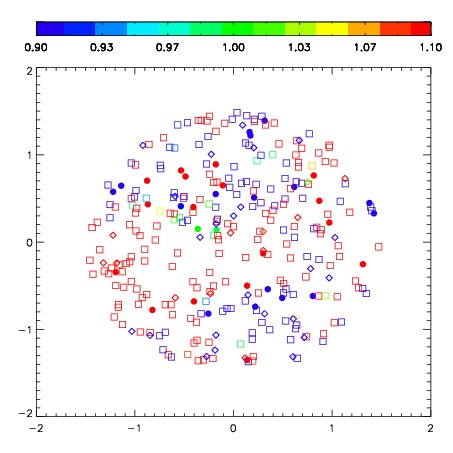


| Frame | Nreads | Zeropoints | Mag plots | Spatial mag deviation | Spatial sky 16325A emission deviations (filled: sky, open: star) | Spatial sky continuum emission | Spatial sky telluric CO2 absorption deviations (filled: H < 10) | |||||||||||||||||||||||
| 0 | 0 |
|
|
|
|
|
|
| IPAIR | NAME | SHIFT | NEWSHIFT | S/N | NAME | SHIFT | NEWSHIFT | S/N |
| 0 | 08480013 | 0.476664 | 0.00000 | 219.887 | 08480014 | -0.735707 | 1.21237 | 156.418 |
| 1 | 08480017 | 0.0301959 | 0.446468 | 237.093 | 08480015 | -0.354836 | 0.831500 | 243.749 |
| 2 | 08480016 | 0.0312546 | 0.445409 | 234.924 | 08480018 | -0.355150 | 0.831814 | 233.193 |
| 3 | 08480012 | 0.473864 | 0.00280002 | 229.597 | 08480011 | 0.00000 | 0.476664 | 208.963 |