| Red | Green | Blue | |
| z | 17.64 | ||
| znorm | Inf | ||
| sky | -NaN | -NaN | -Inf |
| S/N | 26.2 | 45.3 | 50.4 |
| S/N(c) | 0.0 | 0.0 | 0.0 |
| SN(E/C) |

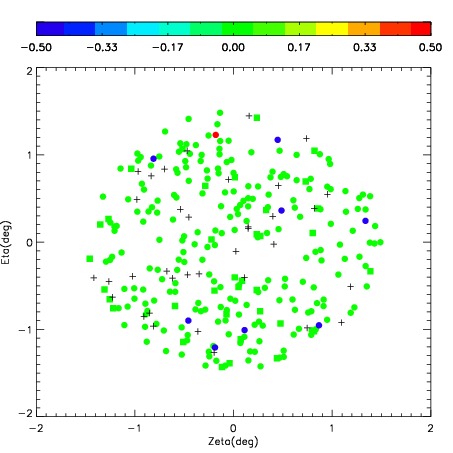
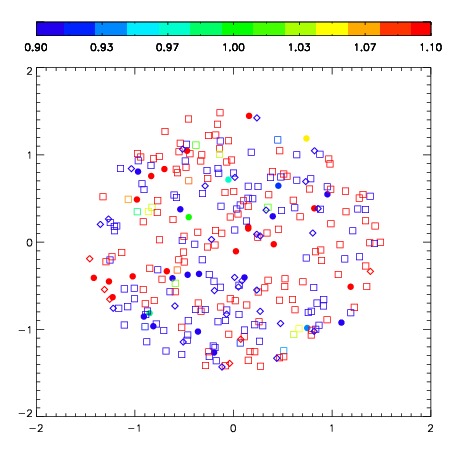
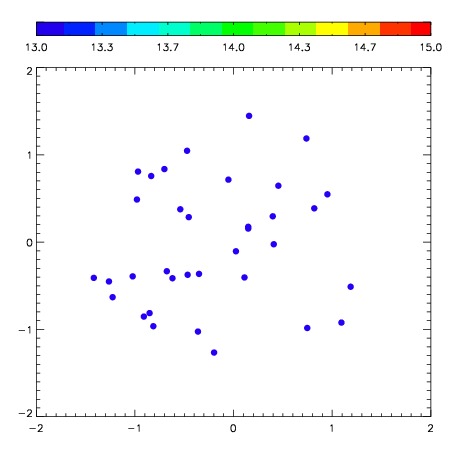

| Frame | Nreads | Zeropoints | Mag plots | Spatial mag deviation | Spatial sky 16325A emission deviations (filled: sky, open: star) | Spatial sky continuum emission | Spatial sky telluric CO2 absorption deviations (filled: H < 10) | |||||||||||||||||||||||
| 0 | 0 |
|
|
|
|
|
|
| IPAIR | NAME | SHIFT | NEWSHIFT | S/N | NAME | SHIFT | NEWSHIFT | S/N |
| 0 | 04280042 | 0.381400 | 0.00000 | 283.752 | 04280041 | 0.00000 | 0.381400 | 268.242 |
| 1 | 04280046 | 0.379174 | 0.00222600 | 294.221 | 04280044 | -0.00601244 | 0.387412 | 293.485 |
| 2 | 04280043 | 0.372719 | 0.00868100 | 291.723 | 04280048 | -0.00836399 | 0.389764 | 291.143 |
| 3 | 04280047 | 0.375360 | 0.00603998 | 288.007 | 04280045 | -0.00618653 | 0.387587 | 290.452 |