| Red | Green | Blue | |
| z | 17.64 | ||
| znorm | Inf | ||
| sky | -Inf | -Inf | -Inf |
| S/N | 22.0 | 39.0 | 42.6 |
| S/N(c) | 0.0 | 0.0 | 0.0 |
| SN(E/C) |

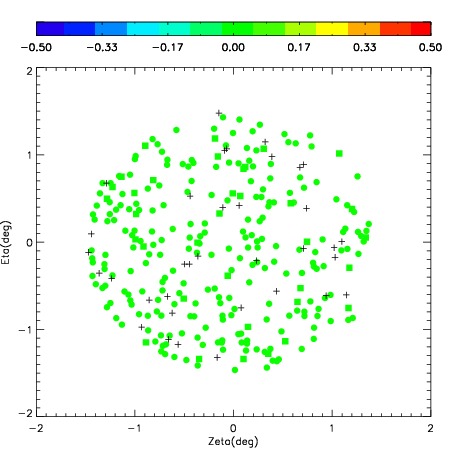
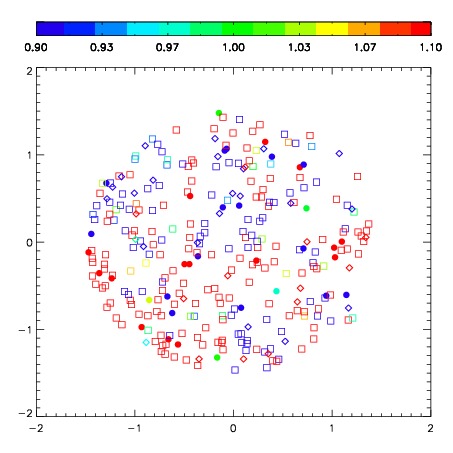


| Frame | Nreads | Zeropoints | Mag plots | Spatial mag deviation | Spatial sky 16325A emission deviations (filled: sky, open: star) | Spatial sky continuum emission | Spatial sky telluric CO2 absorption deviations (filled: H < 10) | |||||||||||||||||||||||
| 0 | 0 |
|
|
|
|
|
|
| IPAIR | NAME | SHIFT | NEWSHIFT | S/N | NAME | SHIFT | NEWSHIFT | S/N |
| 0 | 07050050 | 0.461396 | 0.00000 | 215.231 | 07050051 | 0.0554543 | 0.405942 | 222.002 |
| 1 | 07050054 | 0.449005 | 0.0123910 | 232.588 | 07050055 | 0.0473970 | 0.413999 | 235.919 |
| 2 | 07050053 | 0.449721 | 0.0116750 | 226.133 | 07050052 | 0.0538157 | 0.407580 | 229.561 |
| 3 | 07050049 | 0.452696 | 0.00870001 | 212.706 | 07050048 | 0.00000 | 0.461396 | 212.636 |