| Red | Green | Blue | |
| z | 17.64 | ||
| znorm | Inf | ||
| sky | -Inf | -Inf | -Inf |
| S/N | 21.4 | 33.8 | 39.8 |
| S/N(c) | 0.0 | 0.0 | 0.0 |
| SN(E/C) |


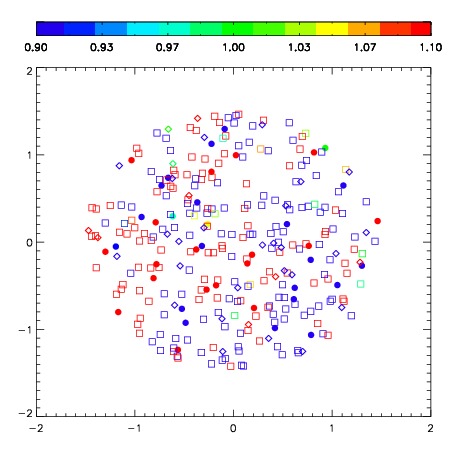


| Frame | Nreads | Zeropoints | Mag plots | Spatial mag deviation | Spatial sky 16325A emission deviations (filled: sky, open: star) | Spatial sky continuum emission | Spatial sky telluric CO2 absorption deviations (filled: H < 10) | |||||||||||||||||||||||
| 0 | 0 |
|
|
|
|
|
|
| IPAIR | NAME | SHIFT | NEWSHIFT | S/N | NAME | SHIFT | NEWSHIFT | S/N |
| 0 | 04600037 | 0.389620 | 0.00000 | 287.865 | 04600043 | 0.00207907 | 0.387541 | 290.164 |
| 1 | 04600042 | 0.378164 | 0.0114560 | 298.007 | 04600039 | 0.00113693 | 0.388483 | 304.873 |
| 2 | 04600038 | 0.380147 | 0.00947300 | 288.324 | 04600040 | -0.00122109 | 0.390841 | 297.481 |
| 3 | 04600041 | 0.378755 | 0.0108650 | 265.869 | 04600036 | 0.00000 | 0.389620 | 286.488 |