| Red | Green | Blue | |
| z | 17.64 | ||
| znorm | Inf | ||
| sky | -Inf | -Inf | -Inf |
| S/N | 24.9 | 40.8 | 46.3 |
| S/N(c) | 0.0 | 0.0 | 0.0 |
| SN(E/C) |

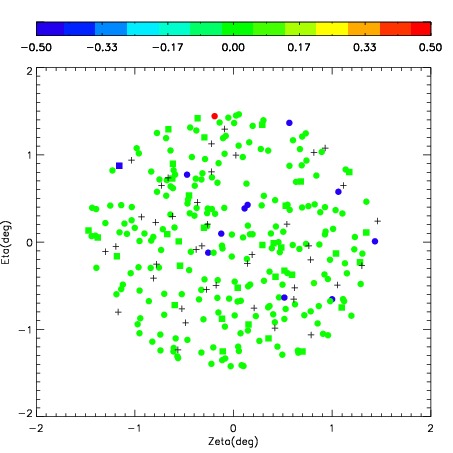

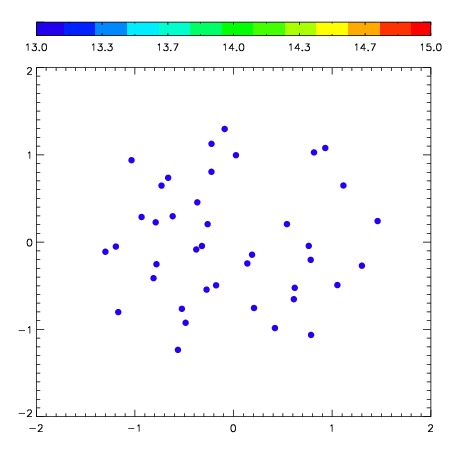
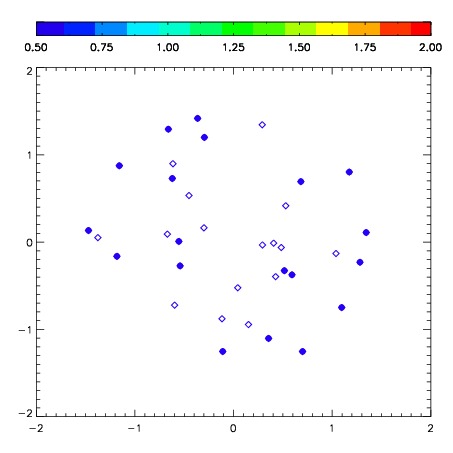
| Frame | Nreads | Zeropoints | Mag plots | Spatial mag deviation | Spatial sky 16325A emission deviations (filled: sky, open: star) | Spatial sky continuum emission | Spatial sky telluric CO2 absorption deviations (filled: H < 10) | |||||||||||||||||||||||
| 0 | 0 |
|
|
|
|
|
|
| IPAIR | NAME | SHIFT | NEWSHIFT | S/N | NAME | SHIFT | NEWSHIFT | S/N |
| 0 | 08170023 | 0.358939 | 0.00000 | 295.673 | 08170022 | 0.00000 | 0.358939 | 250.947 |
| 1 | 08170028 | 0.318826 | 0.0401130 | 313.543 | 08170029 | -0.0245825 | 0.383521 | 316.078 |
| 2 | 08170027 | 0.351419 | 0.00751999 | 312.214 | 08170026 | -0.0370984 | 0.396037 | 302.445 |
| 3 | 08170024 | 0.357636 | 0.00130299 | 306.853 | 08170025 | -0.0350813 | 0.394020 | 297.119 |