| Red | Green | Blue | |
| z | 17.64 | ||
| znorm | Inf | ||
| sky | -NaN | -NaN | -Inf |
| S/N | 25.3 | 44.5 | 49.6 |
| S/N(c) | 0.0 | 0.0 | 0.0 |
| SN(E/C) |

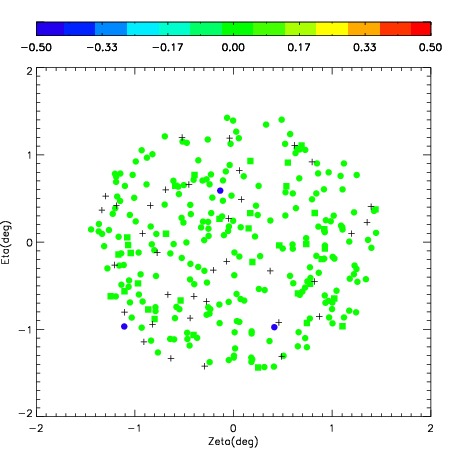
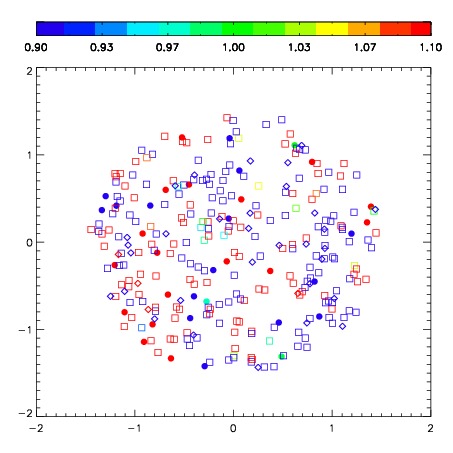

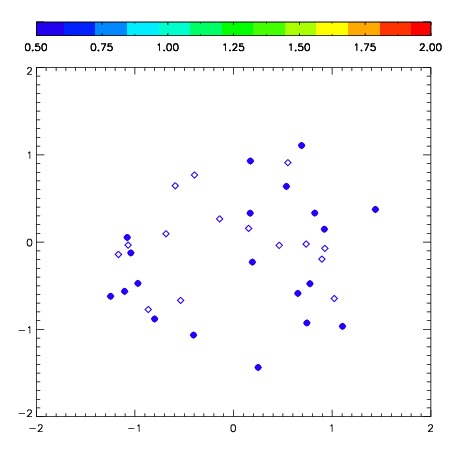
| Frame | Nreads | Zeropoints | Mag plots | Spatial mag deviation | Spatial sky 16325A emission deviations (filled: sky, open: star) | Spatial sky continuum emission | Spatial sky telluric CO2 absorption deviations (filled: H < 10) | |||||||||||||||||||||||
| 0 | 0 |
|
|
|
|
|
|
| IPAIR | NAME | SHIFT | NEWSHIFT | S/N | NAME | SHIFT | NEWSHIFT | S/N |
| 0 | 04060038 | 0.407567 | 0.00000 | 266.849 | 04060037 | 0.00000 | 0.407567 | 270.813 |
| 1 | 04060043 | 0.396234 | 0.0113330 | 297.638 | 04060044 | 0.0267114 | 0.380856 | 292.816 |
| 2 | 04060042 | 0.401726 | 0.00584099 | 287.881 | 04060040 | 0.0273311 | 0.380236 | 291.826 |
| 3 | 04060039 | 0.404250 | 0.00331700 | 276.673 | 04060041 | 0.0269547 | 0.380612 | 287.313 |