| Red | Green | Blue | |
| z | 17.64 | ||
| znorm | Inf | ||
| sky | -NaN | -Inf | -Inf |
| S/N | 22.7 | 40.1 | 42.8 |
| S/N(c) | 0.0 | 0.0 | 0.0 |
| SN(E/C) |

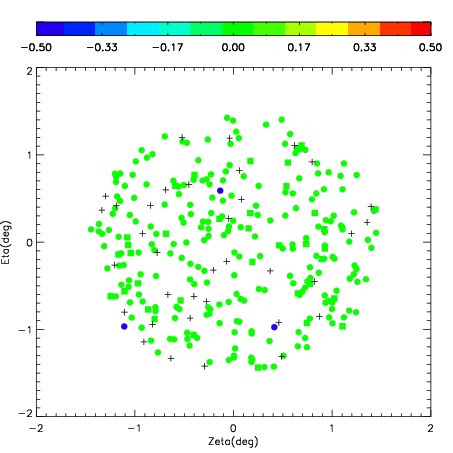
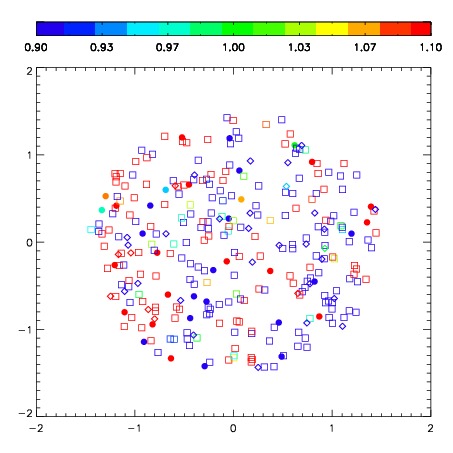
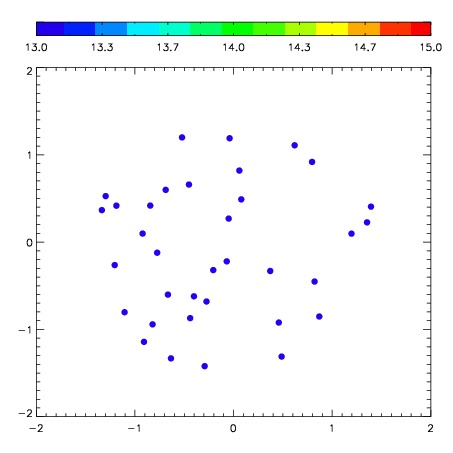

| Frame | Nreads | Zeropoints | Mag plots | Spatial mag deviation | Spatial sky 16325A emission deviations (filled: sky, open: star) | Spatial sky continuum emission | Spatial sky telluric CO2 absorption deviations (filled: H < 10) | |||||||||||||||||||||||
| 0 | 0 |
|
|
|
|
|
|
| IPAIR | NAME | SHIFT | NEWSHIFT | S/N | NAME | SHIFT | NEWSHIFT | S/N |
| 0 | 08410012 | 0.549329 | 0.00000 | 255.582 | 08410015 | 0.0742674 | 0.475062 | 254.432 |
| 1 | 08410017 | 0.528056 | 0.0212730 | 271.074 | 08410018 | 0.0673414 | 0.481988 | 270.954 |
| 2 | 08410016 | 0.529889 | 0.0194400 | 268.535 | 08410011 | 0.00000 | 0.549329 | 257.142 |
| 3 | 08410013 | 0.538118 | 0.0112110 | 253.661 | 08410014 | 0.0740772 | 0.475252 | 249.313 |