| Red | Green | Blue | |
| z | 17.64 | ||
| znorm | Inf | ||
| sky | -NaN | -NaN | -Inf |
| S/N | 27.3 | 47.1 | 52.2 |
| S/N(c) | 0.0 | 0.0 | 0.0 |
| SN(E/C) |

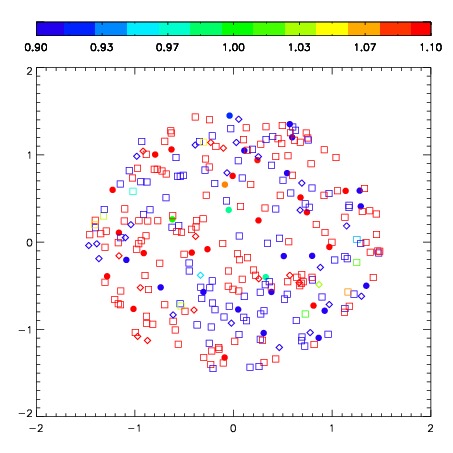
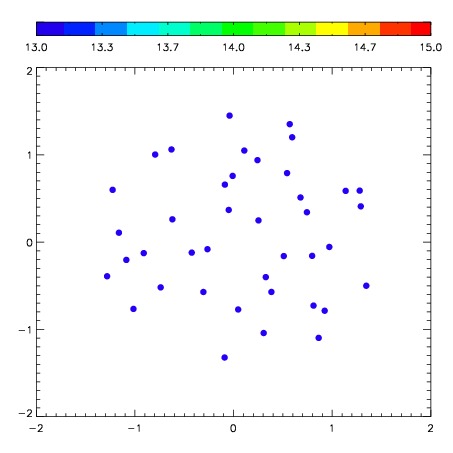
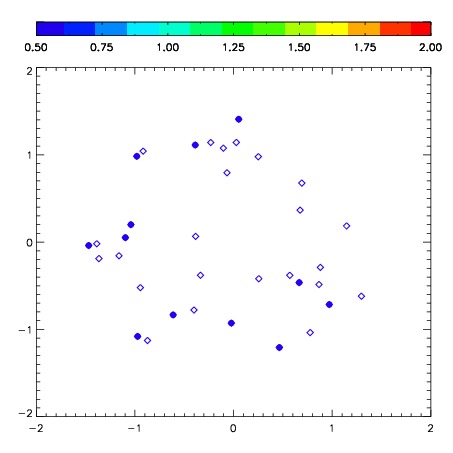
| Frame | Nreads | Zeropoints | Mag plots | Spatial mag deviation | Spatial sky 16325A emission deviations (filled: sky, open: star) | Spatial sky continuum emission | Spatial sky telluric CO2 absorption deviations (filled: H < 10) | |||||||||||||||||||||||
| 0 | 0 |
|
|
|
|
|
|
| IPAIR | NAME | SHIFT | NEWSHIFT | S/N | NAME | SHIFT | NEWSHIFT | S/N |
| 0 | 08470051 | 0.452114 | 0.00000 | 231.943 | 08470052 | 0.0276383 | 0.424476 | 234.103 |
| 1 | 08470046 | 0.446159 | 0.00595498 | 231.640 | 08470049 | 0.0247156 | 0.427398 | 232.242 |
| 2 | 08470050 | 0.447190 | 0.00492400 | 227.975 | 08470045 | 0.00000 | 0.452114 | 231.288 |
| 3 | 08470047 | 0.450072 | 0.00204200 | 223.956 | 08470048 | 0.0297335 | 0.422380 | 226.070 |