| Red | Green | Blue | |
| z | 17.64 | ||
| znorm | Inf | ||
| sky | -NaN | -NaN | -Inf |
| S/N | 26.2 | 43.4 | 47.9 |
| S/N(c) | 0.0 | 0.0 | 0.0 |
| SN(E/C) |
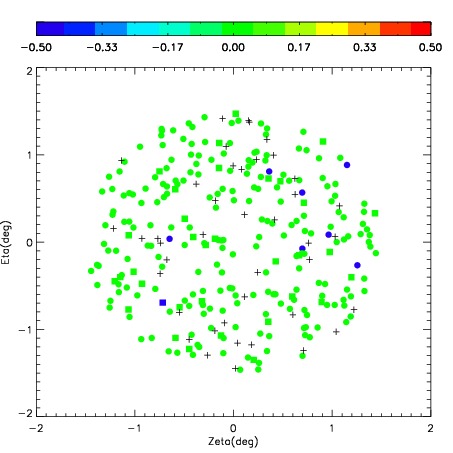


| Frame | Nreads | Zeropoints | Mag plots | Spatial mag deviation | Spatial sky 16325A emission deviations (filled: sky, open: star) | Spatial sky continuum emission | Spatial sky telluric CO2 absorption deviations (filled: H < 10) | |||||||||||||||||||||||
| 0 | 0 |
|
|
|
|
|
|
| IPAIR | NAME | SHIFT | NEWSHIFT | S/N | NAME | SHIFT | NEWSHIFT | S/N |
| 0 | 04370031 | 0.374738 | 0.00000 | 206.515 | 04370032 | 0.0128147 | 0.361923 | 210.316 |
| 1 | 04370026 | 0.370705 | 0.00403300 | 205.661 | 04370029 | 0.0130129 | 0.361725 | 207.515 |
| 2 | 04370030 | 0.370432 | 0.00430602 | 204.225 | 04370025 | 0.00000 | 0.374738 | 206.833 |
| 3 | 04370027 | 0.364365 | 0.0103730 | 203.470 | 04370028 | 0.0140203 | 0.360718 | 204.481 |