| Red | Green | Blue | |
| z | 17.64 | ||
| znorm | Inf | ||
| sky | -NaN | -NaN | -Inf |
| S/N | 18.0 | 33.4 | 40.2 |
| S/N(c) | 0.0 | 0.0 | 0.0 |
| SN(E/C) |
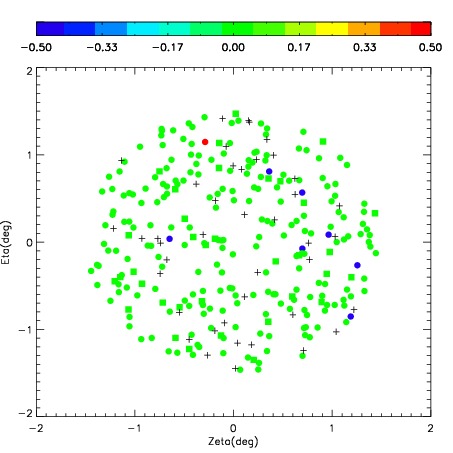
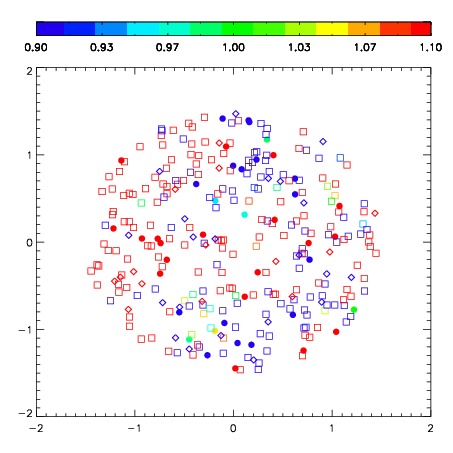
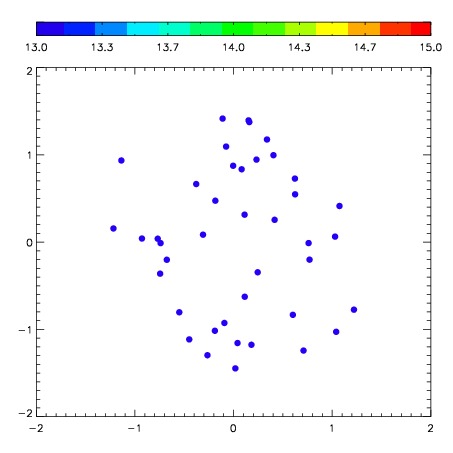
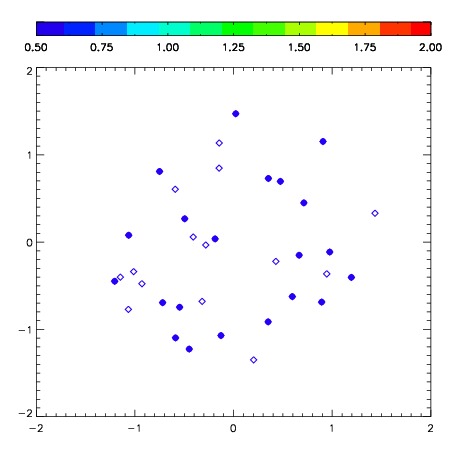
| Frame | Nreads | Zeropoints | Mag plots | Spatial mag deviation | Spatial sky 16325A emission deviations (filled: sky, open: star) | Spatial sky continuum emission | Spatial sky telluric CO2 absorption deviations (filled: H < 10) | |||||||||||||||||||||||
| 0 | 0 |
|
|
|
|
|
|
| IPAIR | NAME | SHIFT | NEWSHIFT | S/N | NAME | SHIFT | NEWSHIFT | S/N |
| 0 | 07830083 | 0.422320 | 0.00000 | 186.117 | 07830082 | 0.00000 | 0.422320 | 190.343 |
| 1 | 07830088 | 0.415764 | 0.00655600 | 202.015 | 07830086 | 0.00645483 | 0.415865 | 201.556 |
| 2 | 07830087 | 0.412334 | 0.00998601 | 199.661 | 07830089 | 0.00874022 | 0.413580 | 197.843 |
| 3 | 07830084 | 0.407767 | 0.0145530 | 192.475 | 07830085 | 0.0103921 | 0.411928 | 195.916 |