| Red | Green | Blue | |
| z | 17.64 | ||
| znorm | Inf | ||
| sky | -Inf | -Inf | -Inf |
| S/N | 20.3 | 37.2 | 41.4 |
| S/N(c) | 0.0 | 0.0 | 0.0 |
| SN(E/C) |

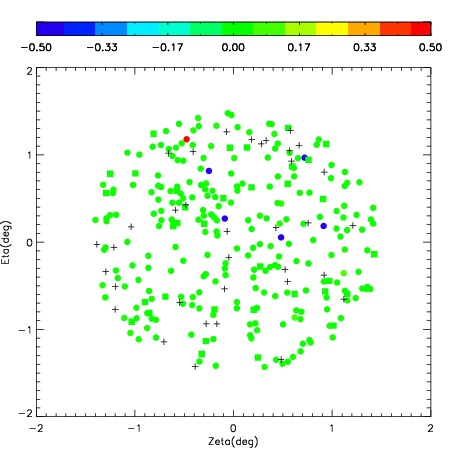
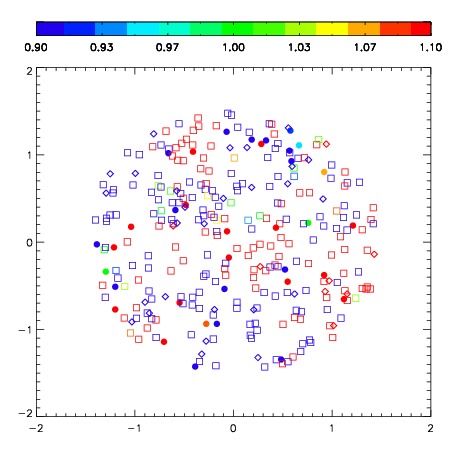
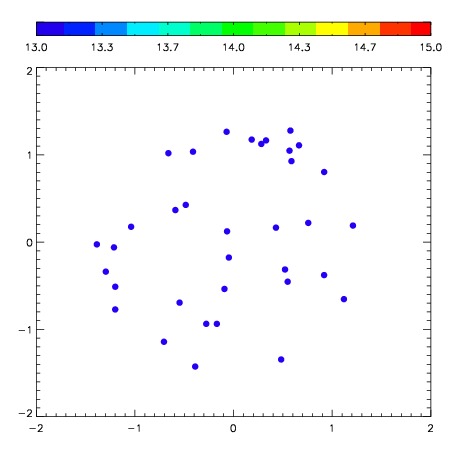

| Frame | Nreads | Zeropoints | Mag plots | Spatial mag deviation | Spatial sky 16325A emission deviations (filled: sky, open: star) | Spatial sky continuum emission | Spatial sky telluric CO2 absorption deviations (filled: H < 10) | |||||||||||||||||||||||
| 0 | 0 |
|
|
|
|
|
|
| IPAIR | NAME | SHIFT | NEWSHIFT | S/N | NAME | SHIFT | NEWSHIFT | S/N |
| 0 | 08760042 | 0.484485 | 0.00000 | 182.722 | 08760044 | 0.0414391 | 0.443046 | 179.310 |
| 1 | 08760038 | 0.450136 | 0.0343490 | 200.066 | 08760037 | 0.00000 | 0.484485 | 193.720 |
| 2 | 08760039 | 0.476083 | 0.00840199 | 188.911 | 08760041 | 0.0418956 | 0.442589 | 186.812 |
| 3 | 08760043 | 0.474892 | 0.00959301 | 181.465 | 08760040 | 0.0470068 | 0.437478 | 172.803 |