| Red | Green | Blue | |
| z | 17.64 | ||
| znorm | Inf | ||
| sky | -Inf | -NaN | -Inf |
| S/N | 18.2 | 28.0 | 29.4 |
| S/N(c) | 0.0 | 0.0 | 0.0 |
| SN(E/C) |

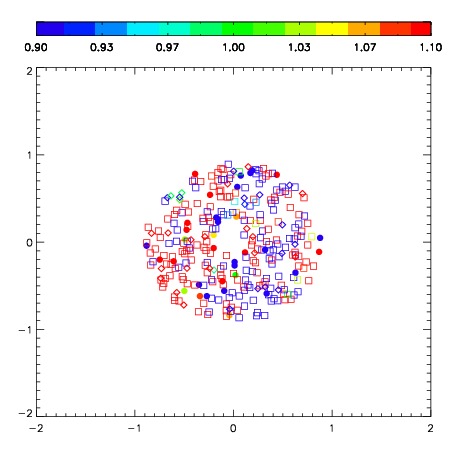
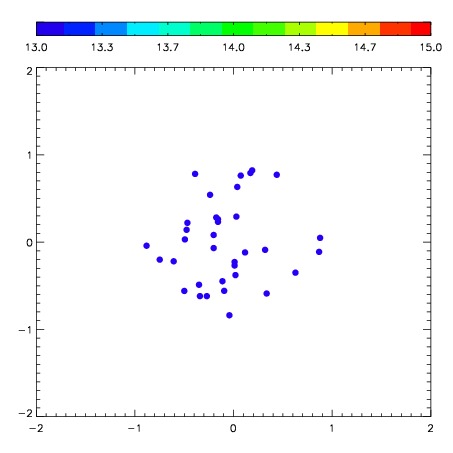
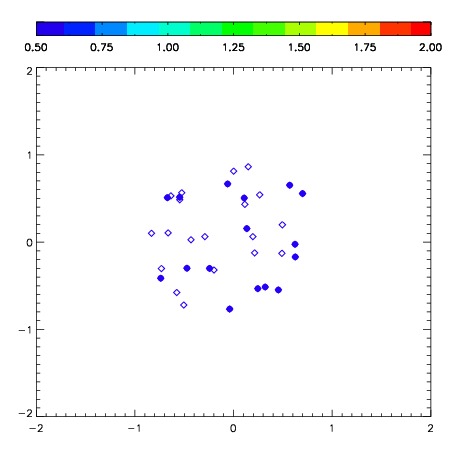
| Frame | Nreads | Zeropoints | Mag plots | Spatial mag deviation | Spatial sky 16325A emission deviations (filled: sky, open: star) | Spatial sky continuum emission | Spatial sky telluric CO2 absorption deviations (filled: H < 10) | |||||||||||||||||||||||
| 0 | 0 |
|
|
|
|
|
|
| IPAIR | NAME | SHIFT | NEWSHIFT | S/N | NAME | SHIFT | NEWSHIFT | S/N |
| 0 | 08710049 | 0.532349 | 0.00000 | 101.737 | 08710048 | 0.0881121 | 0.444237 | 102.858 |
| 1 | 08710050 | 0.502887 | 0.0294620 | 136.678 | 08710044 | 0.00000 | 0.532349 | 145.741 |
| 2 | 08710045 | 0.517093 | 0.0152560 | 117.208 | 08710051 | 0.0755123 | 0.456837 | 136.811 |
| 3 | 08710046 | 0.524658 | 0.00769097 | 110.177 | 08710047 | 0.0802912 | 0.452058 | 105.878 |