| Red | Green | Blue | |
| z | 17.64 | ||
| znorm | Inf | ||
| sky | -Inf | -Inf | -Inf |
| S/N | 24.1 | 34.1 | 36.6 |
| S/N(c) | 0.0 | 0.0 | 0.0 |
| SN(E/C) |

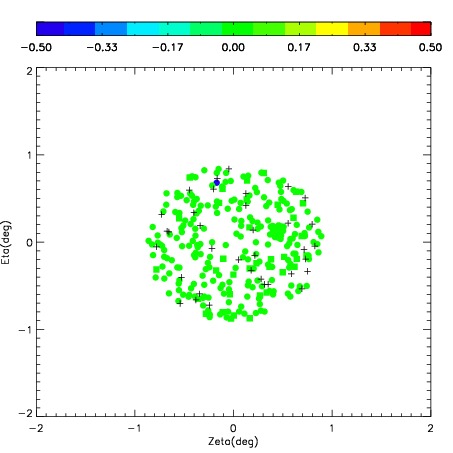
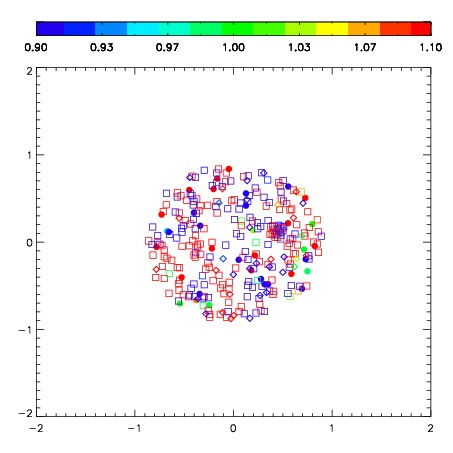


| Frame | Nreads | Zeropoints | Mag plots | Spatial mag deviation | Spatial sky 16325A emission deviations (filled: sky, open: star) | Spatial sky continuum emission | Spatial sky telluric CO2 absorption deviations (filled: H < 10) | |||||||||||||||||||||||
| 0 | 0 |
|
|
|
|
|
|
| IPAIR | NAME | SHIFT | NEWSHIFT | S/N | NAME | SHIFT | NEWSHIFT | S/N |
| 0 | 08460118 | 0.510835 | 0.00000 | 167.437 | 08460120 | 0.0420765 | 0.468758 | 204.650 |
| 1 | 08460121 | 0.489677 | 0.0211580 | 225.475 | 08460116 | 0.00000 | 0.510835 | 212.992 |
| 2 | 08460117 | 0.503198 | 0.00763696 | 185.182 | 08460119 | 0.0454302 | 0.465405 | 208.388 |