| Red | Green | Blue | |
| z | 17.64 | ||
| znorm | Inf | ||
| sky | -NaN | -Inf | -Inf |
| S/N | 33.8 | 49.1 | 53.5 |
| S/N(c) | 0.0 | 0.0 | 0.0 |
| SN(E/C) |

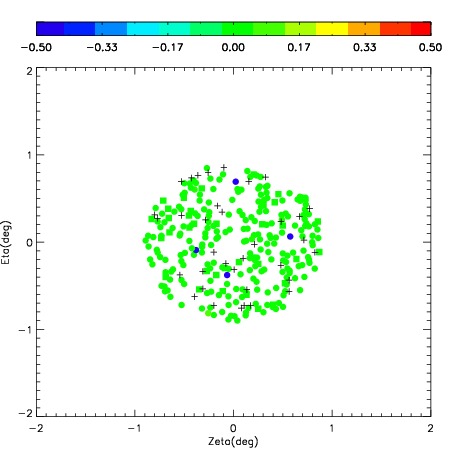


| Frame | Nreads | Zeropoints | Mag plots | Spatial mag deviation | Spatial sky 16325A emission deviations (filled: sky, open: star) | Spatial sky continuum emission | Spatial sky telluric CO2 absorption deviations (filled: H < 10) | |||||||||||||||||||||||
| 0 | 0 |
|
|
|
|
|
|
| IPAIR | NAME | SHIFT | NEWSHIFT | S/N | NAME | SHIFT | NEWSHIFT | S/N |
| 0 | 04600082 | 0.424109 | 0.00000 | 245.261 | 04600087 | -0.00726674 | 0.431376 | 271.198 |
| 1 | 04600081 | 0.422262 | 0.00184700 | 243.704 | 04600084 | -0.00275789 | 0.426867 | 248.419 |
| 2 | 04600086 | 0.410734 | 0.0133750 | 0.00000 | 04600083 | -0.00294344 | 0.427052 | 244.342 |
| 3 | 04600085 | 0.415849 | 0.00826001 | 0.00000 | 04600080 | 0.00000 | 0.424109 | 242.451 |