| Red | Green | Blue | |
| z | 17.64 | ||
| znorm | Inf | ||
| sky | -Inf | -Inf | -Inf |
| S/N | 22.9 | 38.9 | 41.5 |
| S/N(c) | 0.0 | 0.0 | 0.0 |
| SN(E/C) |
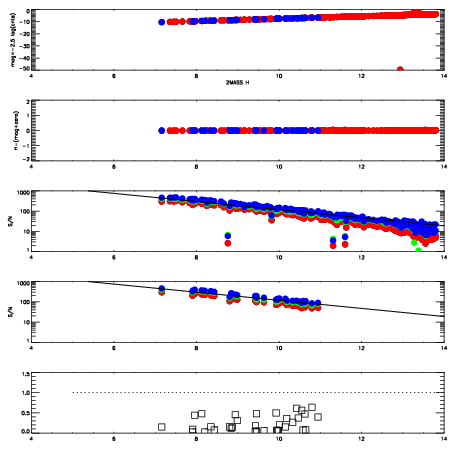

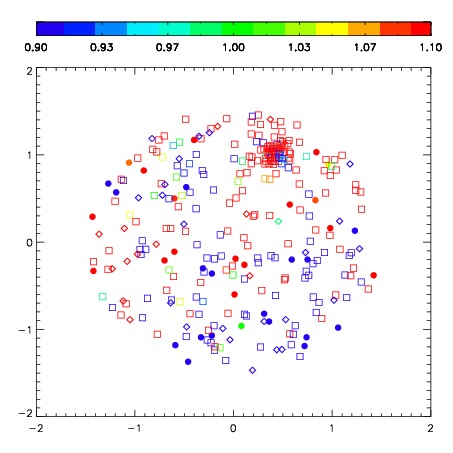
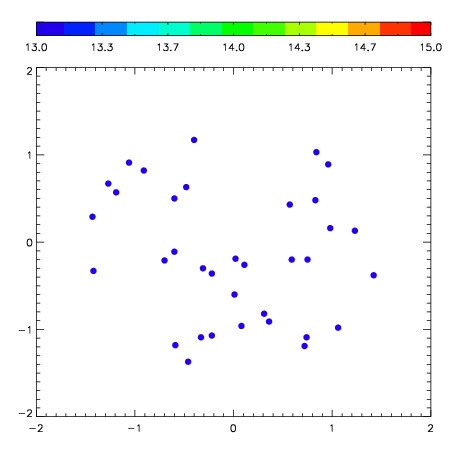

| Frame | Nreads | Zeropoints | Mag plots | Spatial mag deviation | Spatial sky 16325A emission deviations (filled: sky, open: star) | Spatial sky continuum emission | Spatial sky telluric CO2 absorption deviations (filled: H < 10) | |||||||||||||||||||||||
| 0 | 0 |
|
|
|
|
|
|
| IPAIR | NAME | SHIFT | NEWSHIFT | S/N | NAME | SHIFT | NEWSHIFT | S/N |
| 0 | 04920052 | 0.429277 | 0.00000 | 190.025 | 04920054 | -0.0321119 | 0.461389 | 147.951 |
| 1 | 04920049 | 0.427608 | 0.00166899 | 223.558 | 04920047 | 0.00000 | 0.429277 | 221.162 |
| 2 | 04920048 | 0.413430 | 0.0158470 | 221.709 | 04920050 | -0.0266599 | 0.455937 | 217.937 |
| 3 | 04920053 | 0.428637 | 0.000640005 | 204.043 | 04920051 | -0.0257583 | 0.455035 | 187.387 |