| Frame | Nreads | Zeropoints | Mag plots
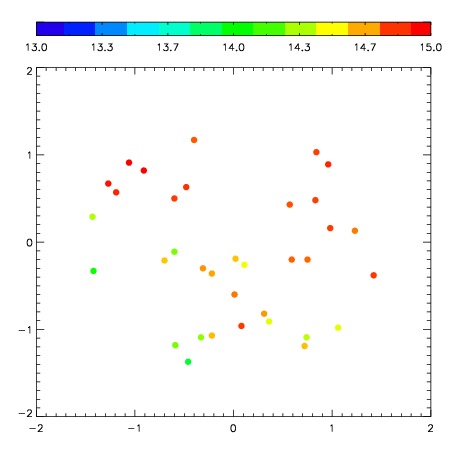
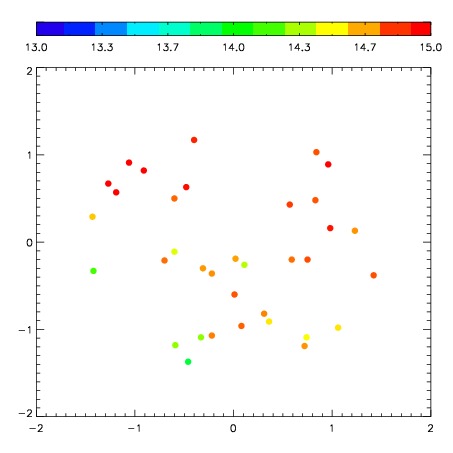
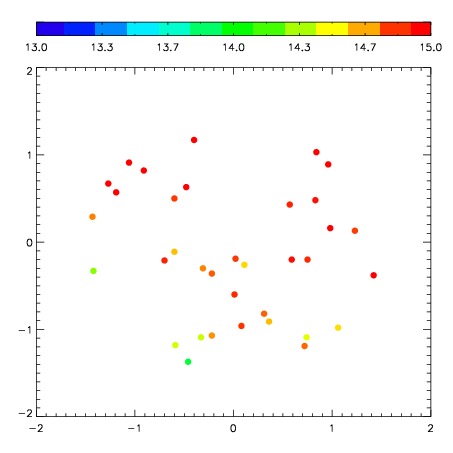
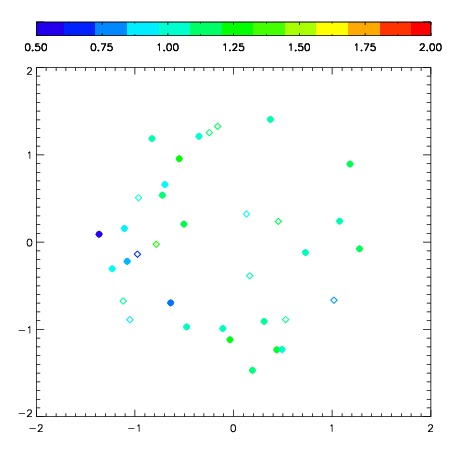
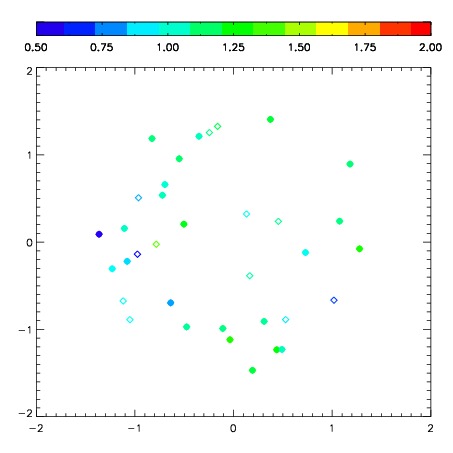
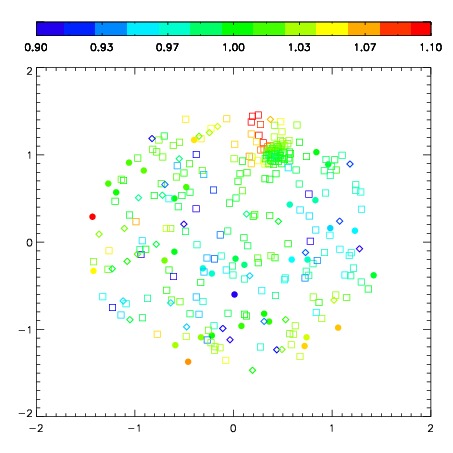
| Spatial mag deviation
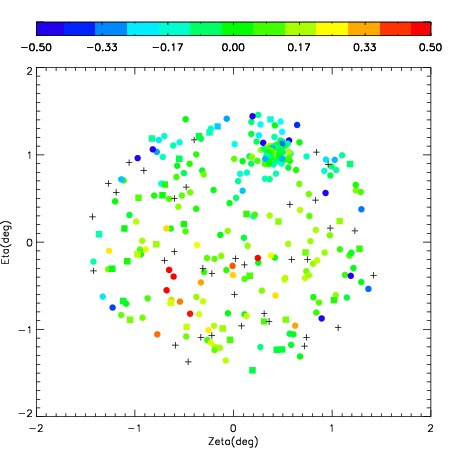
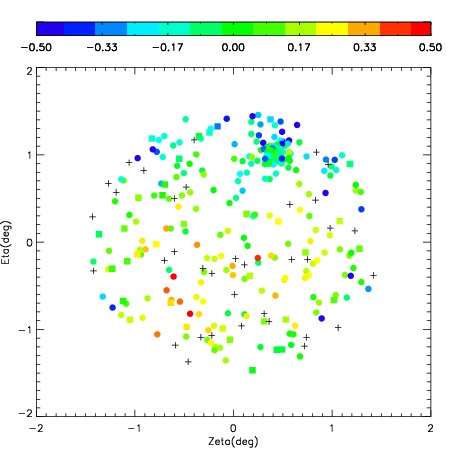
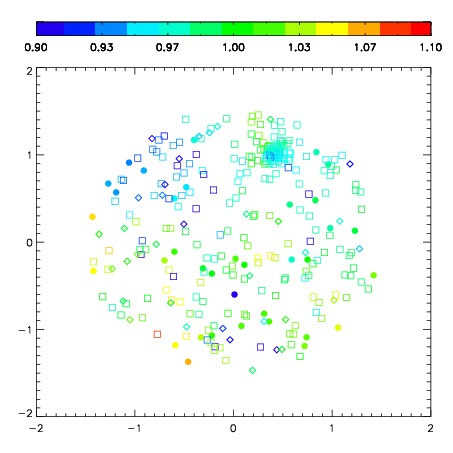
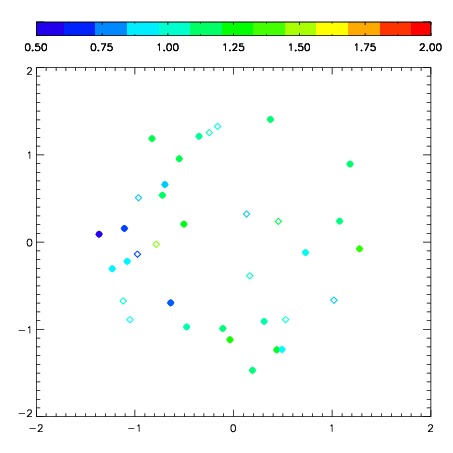
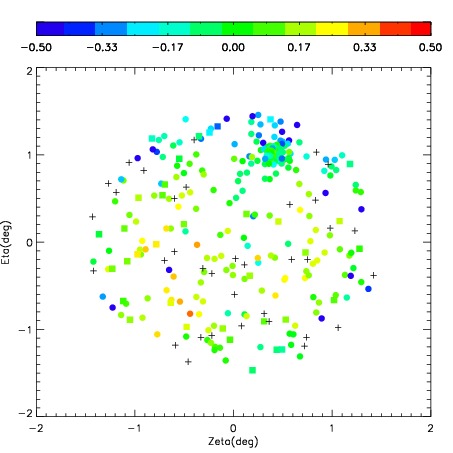
| Spatial sky 16325A emission deviations (filled: sky, open: star)
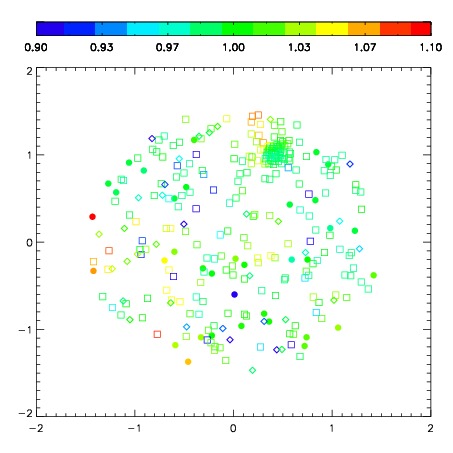
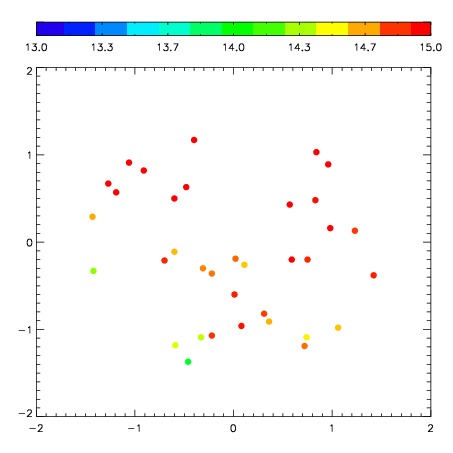
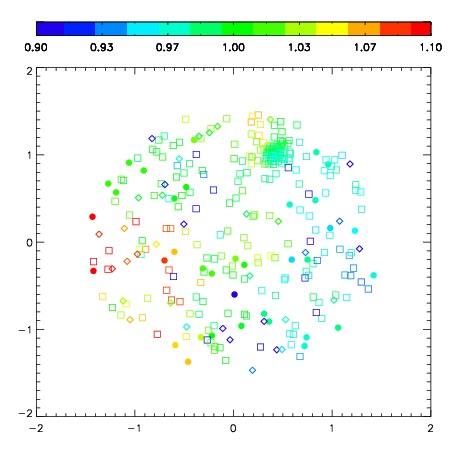
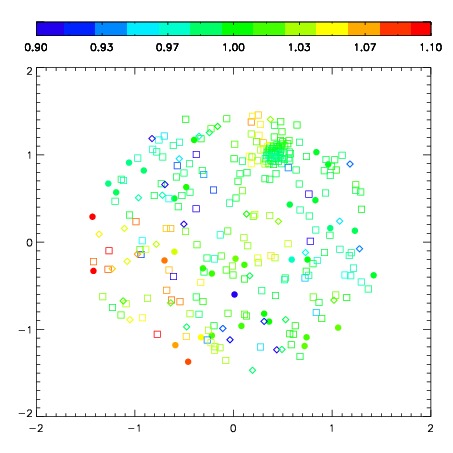
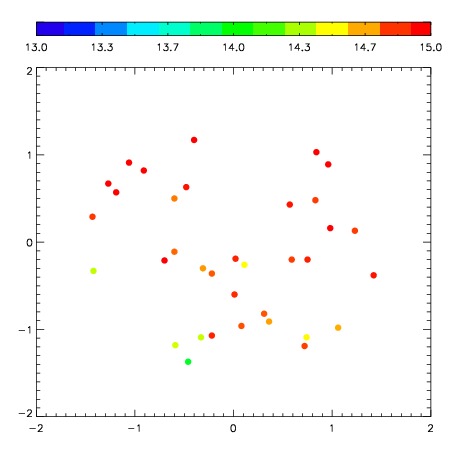
| Spatial sky continuum emission
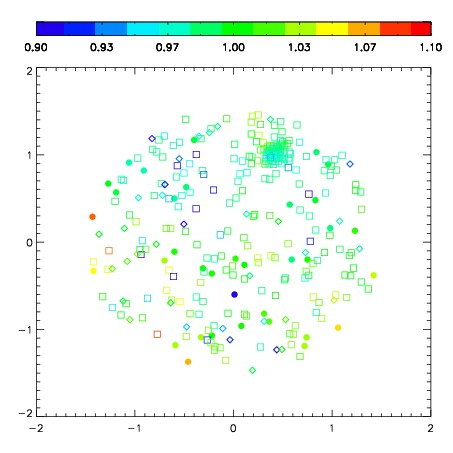
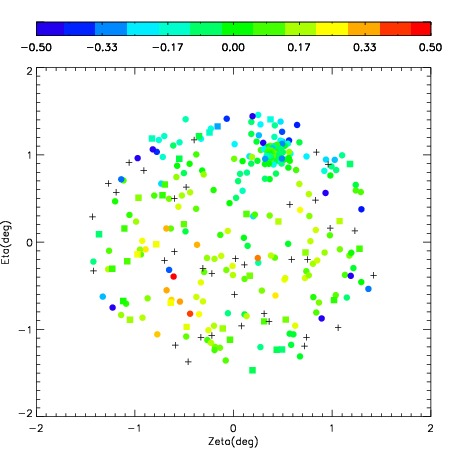
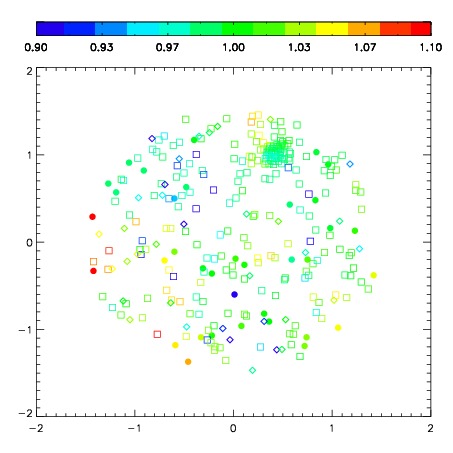
| Spatial sky telluric CO2 absorption deviations (filled: H < 10)
|
| 7830093
| 47
| | Red | Green | Blue
| | z | | 18.24
| | znorm | | 14.06
| | sky | 15.2 | 14.7 | 14.3
| | S/N | 9.8 | 17.4 | 17.3
| | S/N(c) | 8.3 | 15.6 | 17.5
| | SN(E/C) 0.49
|
| 
| 
| 
| 
| 
|
| 7830094
| 47
| | Red | Green | Blue
| | z | | 18.47
| | znorm | | 14.29
| | sky | 15.5 | 14.7 | 14.7
| | S/N | 12.0 | 20.7 | 20.8
| | S/N(c) | 10.4 | 18.9 | 19.9
| | SN(E/C) 0.43
|
| 
| 
| 
| 
| 
|
| 7830095
| 47
| | Red | Green | Blue
| | z | | 18.59
| | znorm | | 14.41
| | sky | 15.2 | 14.8 | 14.7
| | S/N | 12.3 | 21.4 | 21.4
| | S/N(c) | 10.9 | 19.3 | 20.4
| | SN(E/C) 0.32
|
| 
| 
| 
| 
| 
|
| 7830096
| 47
| | Red | Green | Blue
| | z | | 18.55
| | znorm | | 14.37
| | sky | 15.1 | 14.8 | 14.6
| | S/N | 12.5 | 21.7 | 21.5
| | S/N(c) | 10.9 | 19.6 | 20.7
| | SN(E/C) 0.42
|
| 
| 
| 
| 
| 
|
| 7830097
| 47
| | Red | Green | Blue
| | z | | 18.69
| | znorm | | 14.51
| | sky | 15.1 | 14.8 | 14.5
| | S/N | 13.5 | 23.1 | 23.2
| | S/N(c) | 11.6 | 21.1 | 22.3
| | SN(E/C) 0.39
|
| 
| 
| 
| 
| 
|
| 7830098
| 47
| | Red | Green | Blue
| | z | | 18.72
| | znorm | | 14.54
| | sky | 14.8 | 14.8 | 14.5
| | S/N | 13.8 | 23.7 | 23.6
| | S/N(c) | 11.8 | 21.4 | 22.8
| | SN(E/C) 0.38
|
| 
| 
| 
| 
| 
|
| 7830099
| 47
| | Red | Green | Blue
| | z | | 18.71
| | znorm | | 14.53
| | sky | 14.7 | 14.7 | 14.5
| | S/N | 14.0 | 23.6 | 23.7
| | S/N(c) | 12.1 | 21.5 | 22.5
| | SN(E/C) 0.39
|
| 
| 
| 
| 
| 
|
| 7830100
| 47
| | Red | Green | Blue
| | z | | 18.80
| | znorm | | 14.62
| | sky | 14.9 | 14.8 | 14.4
| | S/N | 14.3 | 24.9 | 24.9
| | S/N(c) | 12.4 | 22.7 | 23.9
| | SN(E/C) 0.40
|
| 
| 
| 
| 
| 
|