| Red | Green | Blue | |
| z | 17.64 | ||
| znorm | Inf | ||
| sky | -NaN | -Inf | -Inf |
| S/N | 21.7 | 31.1 | 33.9 |
| S/N(c) | 20.7 | 29.5 | 32.8 |
| SN(E/C) |
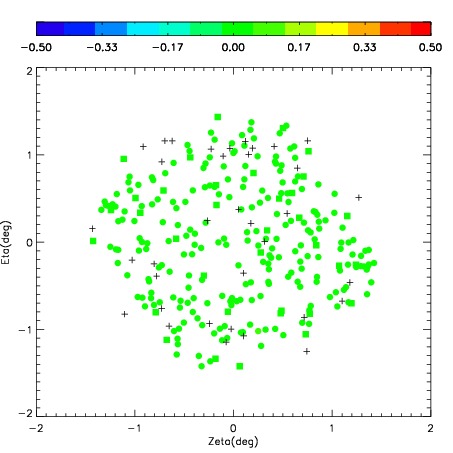
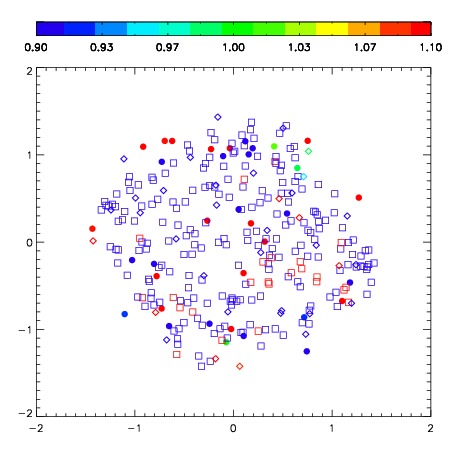


| Frame | Nreads | Zeropoints | Mag plots | Spatial mag deviation | Spatial sky 16325A emission deviations (filled: sky, open: star) | Spatial sky continuum emission | Spatial sky telluric CO2 absorption deviations (filled: H < 10) | |||||||||||||||||||||||
| 0 | 0 |
|
|
|
|
|
|
| IPAIR | NAME | SHIFT | NEWSHIFT | S/N | NAME | SHIFT | NEWSHIFT | S/N |
| 0 | 04650064 | 0.245589 | 0.00000 | 237.761 | 04650065 | -0.0114670 | 0.257056 | 260.799 |
| 1 | 04650059 | 0.216590 | 0.0289990 | 307.902 | 04650058 | 0.00000 | 0.245589 | 308.439 |
| 2 | 04650060 | 0.219291 | 0.0262980 | 294.049 | 04650062 | -0.0119345 | 0.257524 | 293.679 |
| 3 | 04650063 | 0.224238 | 0.0213510 | 277.276 | 04650061 | -0.0140991 | 0.259688 | 281.856 |