| Red | Green | Blue | |
| z | 17.64 | ||
| znorm | Inf | ||
| sky | -Inf | -NaN | -Inf |
| S/N | 16.0 | 25.4 | 25.5 |
| S/N(c) | 0.0 | 0.0 | 0.0 |
| SN(E/C) |

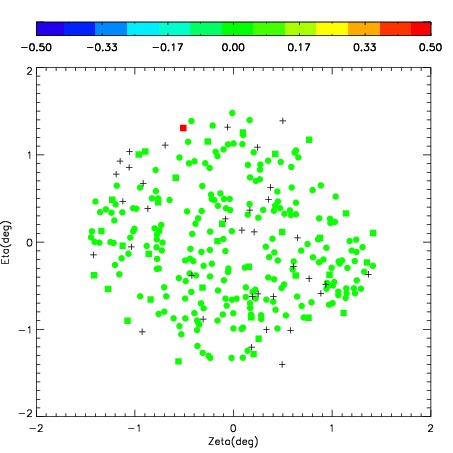
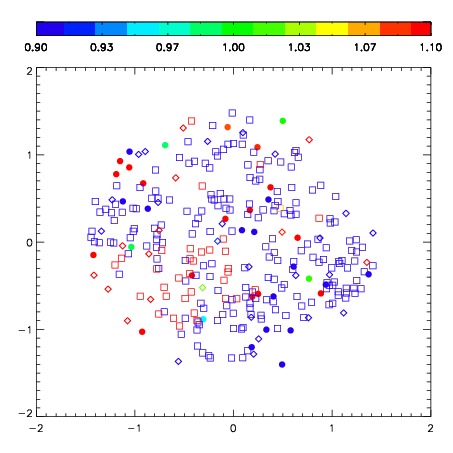


| Frame | Nreads | Zeropoints | Mag plots | Spatial mag deviation | Spatial sky 16325A emission deviations (filled: sky, open: star) | Spatial sky continuum emission | Spatial sky telluric CO2 absorption deviations (filled: H < 10) | |||||||||||||||||||||||
| 0 | 0 |
|
|
|
|
|
|
| IPAIR | NAME | SHIFT | NEWSHIFT | S/N | NAME | SHIFT | NEWSHIFT | S/N |
| 0 | 04630040 | 0.240027 | 0.00000 | 184.187 | 04630041 | -0.00595240 | 0.245979 | 183.256 |
| 1 | 04630035 | 0.228067 | 0.0119600 | 194.555 | 04630034 | 0.00000 | 0.240027 | 194.093 |
| 2 | 04630036 | 0.236113 | 0.00391400 | 193.508 | 04630037 | -0.0110469 | 0.251074 | 187.413 |
| 3 | 04630039 | 0.237124 | 0.00290300 | 182.313 | 04630038 | -0.0107177 | 0.250745 | 180.918 |