| Red | Green | Blue | |
| z | 17.64 | ||
| znorm | Inf | ||
| sky | -Inf | -Inf | -Inf |
| S/N | 23.9 | 39.8 | 43.8 |
| S/N(c) | 0.0 | 0.0 | 0.0 |
| SN(E/C) |

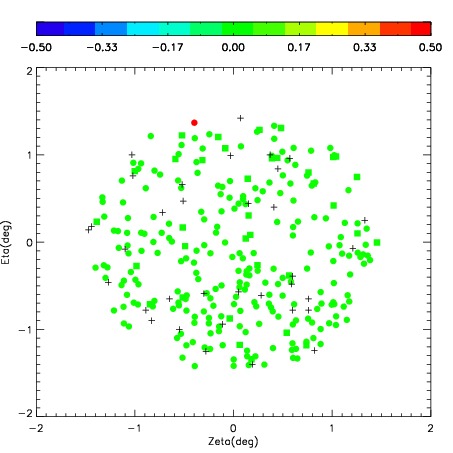
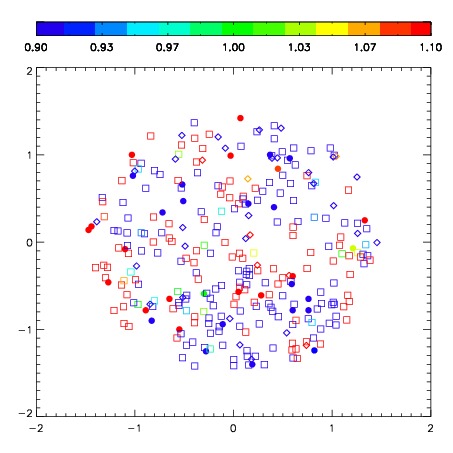


| Frame | Nreads | Zeropoints | Mag plots | Spatial mag deviation | Spatial sky 16325A emission deviations (filled: sky, open: star) | Spatial sky continuum emission | Spatial sky telluric CO2 absorption deviations (filled: H < 10) | |||||||||||||||||||||||
| 0 | 0 |
|
|
|
|
|
|
| IPAIR | NAME | SHIFT | NEWSHIFT | S/N | NAME | SHIFT | NEWSHIFT | S/N |
| 0 | 05180034 | 0.394509 | 0.00000 | 250.149 | 05180033 | 0.00000 | 0.394509 | 242.645 |
| 1 | 05180039 | 0.391493 | 0.00301600 | 257.615 | 05180036 | 0.0200738 | 0.374435 | 257.776 |
| 2 | 05180035 | 0.394480 | 2.89977e-05 | 255.815 | 05180040 | 0.0184590 | 0.376050 | 253.293 |
| 3 | 05180038 | 0.389903 | 0.00460598 | 250.887 | 05180037 | 0.0194286 | 0.375080 | 252.365 |