| Red | Green | Blue | |
| z | 17.63 | ||
| znorm | Inf | ||
| sky | -NaN | -NaN | -Inf |
| S/N | 29.9 | 41.1 | 32.3 |
| S/N(c) | 0.0 | 0.0 | 0.0 |
| SN(E/C) |
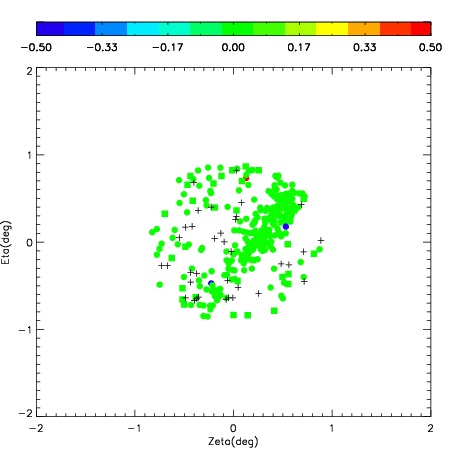
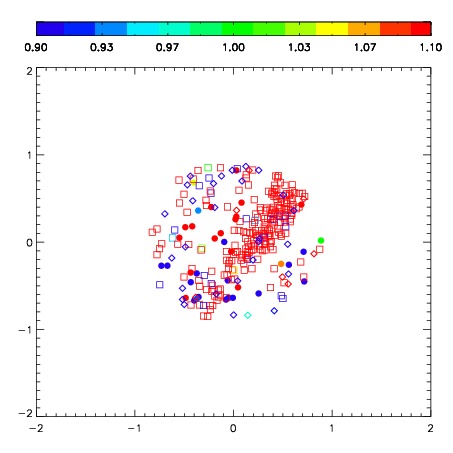
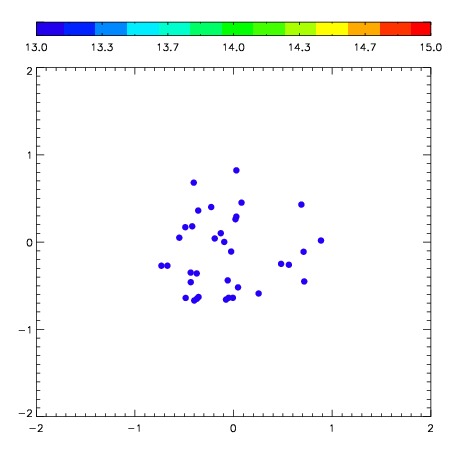
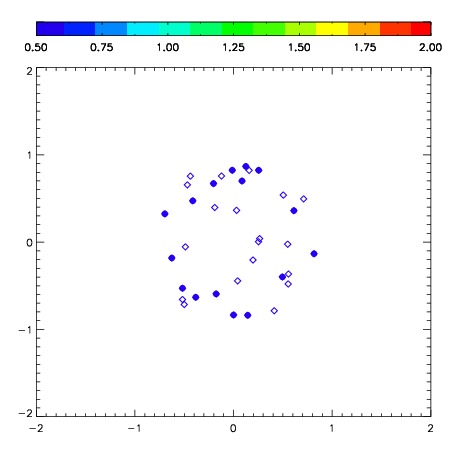
| Frame | Nreads | Zeropoints | Mag plots | Spatial mag deviation | Spatial sky 16325A emission deviations (filled: sky, open: star) | Spatial sky continuum emission | Spatial sky telluric CO2 absorption deviations (filled: H < 10) | |||||||||||||||||||||||
| 0 | 0 |
|
|
|
|
|
|
| IPAIR | NAME | SHIFT | NEWSHIFT | S/N | NAME | SHIFT | NEWSHIFT | S/N |
| 0 | 05240057 | 0.356275 | 0.00000 | 244.843 | 05240059 | -0.0494481 | 0.405723 | 244.945 |
| 1 | 05240054 | 0.350279 | 0.00599599 | 262.228 | 05240055 | -0.0487884 | 0.405063 | 262.917 |
| 2 | 05240053 | 0.351623 | 0.00465199 | 261.596 | 05240052 | 0.00000 | 0.356275 | 262.209 |
| 3 | 05240058 | 0.346505 | 0.00977001 | 255.945 | 05240056 | -0.0491456 | 0.405421 | 253.164 |