| Red | Green | Blue | |
| z | 17.64 | ||
| znorm | Inf | ||
| sky | -Inf | -Inf | -Inf |
| S/N | 20.5 | 32.6 | 37.6 |
| S/N(c) | 0.0 | 0.0 | 0.0 |
| SN(E/C) |

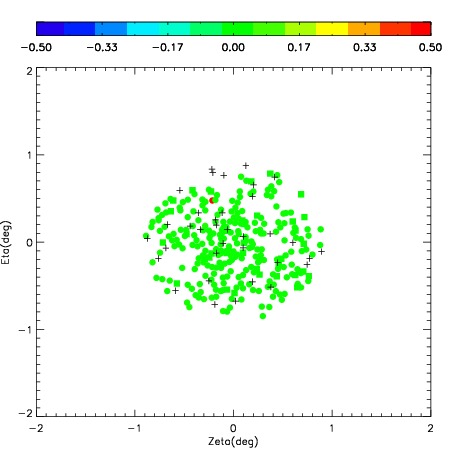
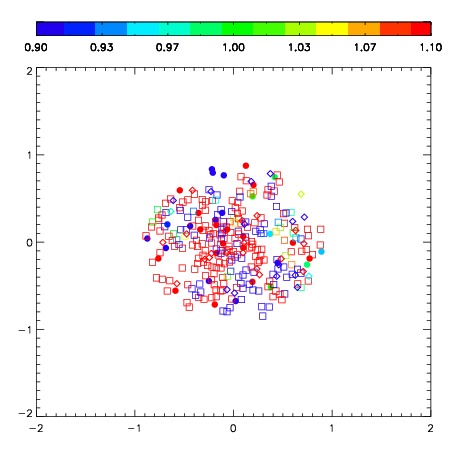
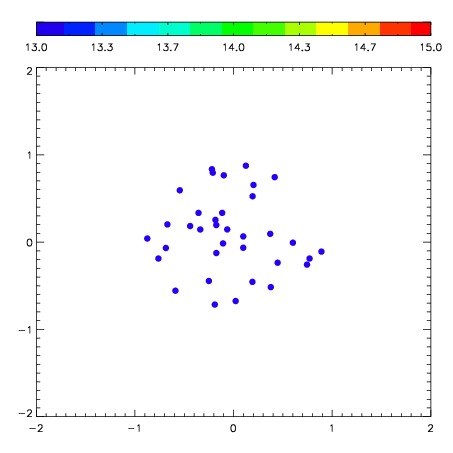

| Frame | Nreads | Zeropoints | Mag plots | Spatial mag deviation | Spatial sky 16325A emission deviations (filled: sky, open: star) | Spatial sky continuum emission | Spatial sky telluric CO2 absorption deviations (filled: H < 10) | |||||||||||||||||||||||
| 0 | 0 |
|
|
|
|
|
|
| IPAIR | NAME | SHIFT | NEWSHIFT | S/N | NAME | SHIFT | NEWSHIFT | S/N |
| 0 | 05180057 | 0.511614 | 0.00000 | 192.107 | 05180058 | 0.0296738 | 0.481940 | 181.406 |
| 1 | 05180056 | 0.503420 | 0.00819403 | 195.791 | 05180055 | 0.00000 | 0.511614 | 190.873 |
| 2 | 05180060 | 0.503372 | 0.00824201 | 169.703 | 05180059 | 0.0308670 | 0.480747 | 139.364 |
| 3 | 05180061 | 0.508046 | 0.00356805 | 97.7076 | 05180062 | 0.0349611 | 0.476653 | 25.2812 |