| Red | Green | Blue | |
| z | 17.64 | ||
| znorm | Inf | ||
| sky | -Inf | -Inf | -Inf |
| S/N | 26.0 | 43.5 | 46.5 |
| S/N(c) | 0.0 | 0.0 | 0.0 |
| SN(E/C) |

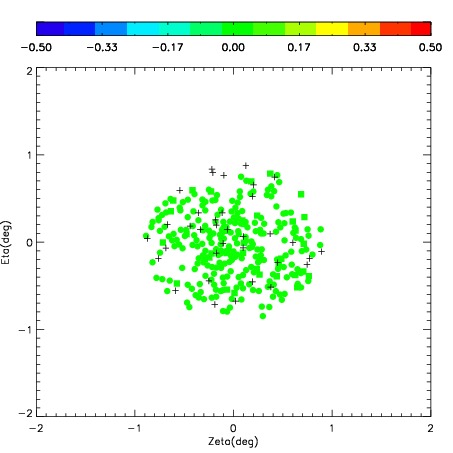


| Frame | Nreads | Zeropoints | Mag plots | Spatial mag deviation | Spatial sky 16325A emission deviations (filled: sky, open: star) | Spatial sky continuum emission | Spatial sky telluric CO2 absorption deviations (filled: H < 10) | |||||||||||||||||||||||
| 0 | 0 |
|
|
|
|
|
|
| IPAIR | NAME | SHIFT | NEWSHIFT | S/N | NAME | SHIFT | NEWSHIFT | S/N |
| 0 | 05250031 | 0.532043 | 0.00000 | 183.967 | 05250033 | 0.0554816 | 0.476561 | 176.576 |
| 1 | 05250032 | 0.531257 | 0.000786006 | 184.557 | 05250030 | 0.0534989 | 0.478544 | 181.769 |
| 2 | 05250028 | 0.530973 | 0.00106996 | 172.654 | 05250029 | 0.0520898 | 0.479953 | 176.237 |
| 3 | 05250027 | 0.530728 | 0.00131500 | 171.346 | 05250026 | 0.00000 | 0.532043 | 171.795 |