| Red | Green | Blue | |
| z | 17.64 | ||
| znorm | Inf | ||
| sky | -Inf | -Inf | -Inf |
| S/N | 24.3 | 40.2 | 41.4 |
| S/N(c) | 0.0 | 0.0 | 0.0 |
| SN(E/C) |


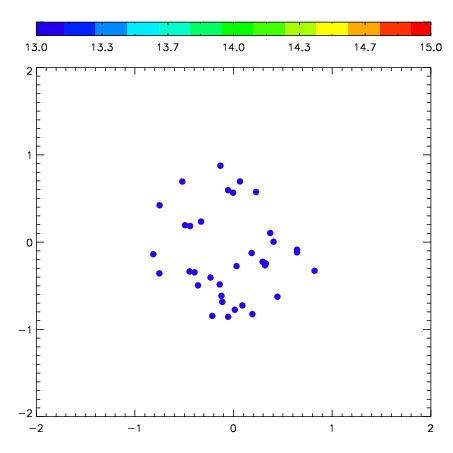
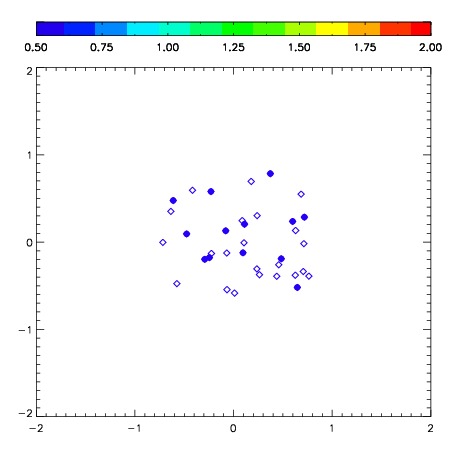
| Frame | Nreads | Zeropoints | Mag plots | Spatial mag deviation | Spatial sky 16325A emission deviations (filled: sky, open: star) | Spatial sky continuum emission | Spatial sky telluric CO2 absorption deviations (filled: H < 10) | |||||||||||||||||||||||
| 0 | 0 |
|
|
|
|
|
|
| IPAIR | NAME | SHIFT | NEWSHIFT | S/N | NAME | SHIFT | NEWSHIFT | S/N |
| 0 | 06020017 | 0.563047 | 0.00000 | 164.589 | 06020011 | 0.00000 | 0.563047 | 174.224 |
| 1 | 06020013 | 0.560954 | 0.00209302 | 188.210 | 06020015 | 0.0769635 | 0.486084 | 191.705 |
| 2 | 06020016 | 0.560272 | 0.00277501 | 186.449 | 06020014 | 0.0820543 | 0.480993 | 188.203 |
| 3 | 06020012 | 0.559917 | 0.00313002 | 180.112 | 06020018 | 0.0765147 | 0.486532 | 175.852 |