| Red | Green | Blue | |
| z | 17.63 | ||
| znorm | Inf | ||
| sky | -NaN | -NaN | -NaN |
| S/N | 19.7 | 28.4 | 28.8 |
| S/N(c) | 0.0 | 0.0 | 0.0 |
| SN(E/C) |


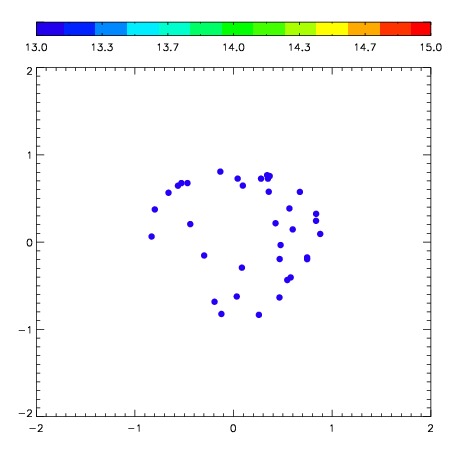

| Frame | Nreads | Zeropoints | Mag plots | Spatial mag deviation | Spatial sky 16325A emission deviations (filled: sky, open: star) | Spatial sky continuum emission | Spatial sky telluric CO2 absorption deviations (filled: H < 10) | |||||||||||||||||||||||
| 0 | 0 |
|
|
|
|
|
|
| IPAIR | NAME | SHIFT | NEWSHIFT | S/N | NAME | SHIFT | NEWSHIFT | S/N |
| 0 | 09090017 | 0.479308 | 0.00000 | 139.166 | 09090011 | 0.00000 | 0.479308 | 205.806 |
| 1 | 09090013 | 0.461062 | 0.0182460 | 213.004 | 09090018 | 0.0222915 | 0.457016 | 218.843 |
| 2 | 09090012 | 0.470163 | 0.00914502 | 186.700 | 09090014 | 0.0252949 | 0.454013 | 206.927 |