| Red | Green | Blue | |
| z | 17.64 | ||
| znorm | Inf | ||
| sky | -Inf | -Inf | -Inf |
| S/N | 29.9 | 43.5 | 46.1 |
| S/N(c) | 0.0 | 0.0 | 0.0 |
| SN(E/C) |
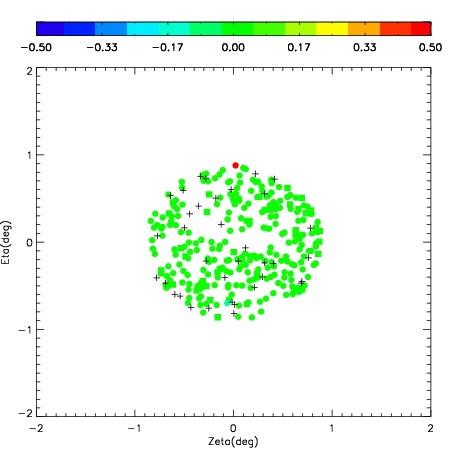
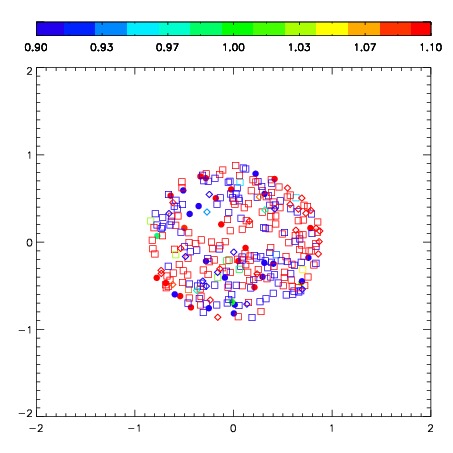
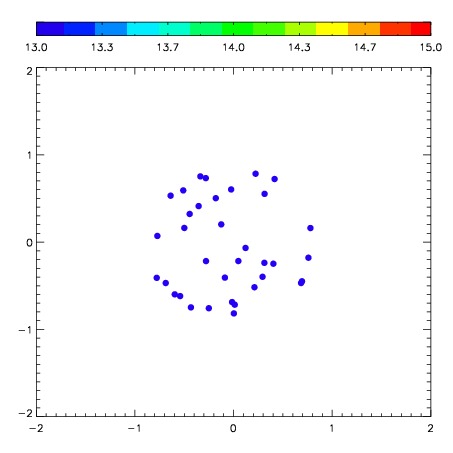
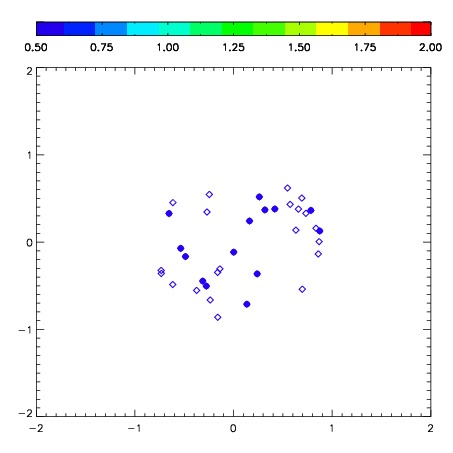
| Frame | Nreads | Zeropoints | Mag plots | Spatial mag deviation | Spatial sky 16325A emission deviations (filled: sky, open: star) | Spatial sky continuum emission | Spatial sky telluric CO2 absorption deviations (filled: H < 10) | |||||||||||||||||||||||
| 0 | 0 |
|
|
|
|
|
|
| IPAIR | NAME | SHIFT | NEWSHIFT | S/N | NAME | SHIFT | NEWSHIFT | S/N |
| 0 | 05220046 | 0.409359 | 0.00000 | 252.310 | 05220047 | -0.0198544 | 0.429213 | 252.458 |
| 1 | 05220042 | 0.403268 | 0.00609100 | 257.976 | 05220044 | -0.0219846 | 0.431344 | 254.872 |
| 2 | 05220041 | 0.403370 | 0.00598902 | 249.210 | 05220043 | -0.0240799 | 0.433439 | 248.893 |
| 3 | 05220045 | 0.403989 | 0.00537002 | 220.539 | 05220040 | 0.00000 | 0.409359 | 247.473 |