| Red | Green | Blue | |
| z | 17.64 | ||
| znorm | Inf | ||
| sky | -Inf | -NaN | -Inf |
| S/N | 20.3 | 33.6 | 35.8 |
| S/N(c) | 0.0 | 0.0 | 0.0 |
| SN(E/C) |
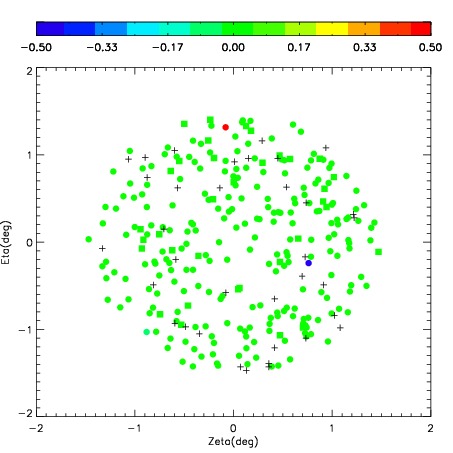
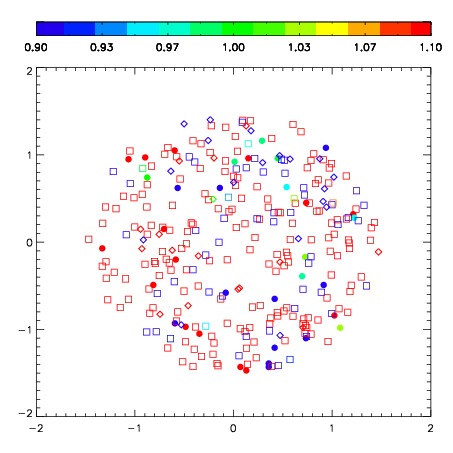


| Frame | Nreads | Zeropoints | Mag plots | Spatial mag deviation | Spatial sky 16325A emission deviations (filled: sky, open: star) | Spatial sky continuum emission | Spatial sky telluric CO2 absorption deviations (filled: H < 10) | |||||||||||||||||||||||
| 0 | 0 |
|
|
|
|
|
|
| IPAIR | NAME | SHIFT | NEWSHIFT | S/N | NAME | SHIFT | NEWSHIFT | S/N |
| 0 | 05480042 | 0.283269 | 0.00000 | 240.494 | 05480039 | -0.0672120 | 0.350481 | 233.205 |
| 1 | 05480037 | 0.264641 | 0.0186280 | 248.156 | 05480036 | 0.00000 | 0.283269 | 241.371 |
| 2 | 05480038 | 0.281670 | 0.00159898 | 239.290 | 05480043 | -0.0731867 | 0.356456 | 228.507 |
| 3 | 05480041 | 0.276512 | 0.00675699 | 234.135 | 05480040 | -0.0707493 | 0.354018 | 227.714 |