| Red | Green | Blue | |
| z | 17.64 | ||
| znorm | Inf | ||
| sky | -NaN | -NaN | -Inf |
| S/N | 25.8 | 42.1 | 44.6 |
| S/N(c) | 0.0 | 0.0 | 0.0 |
| SN(E/C) |

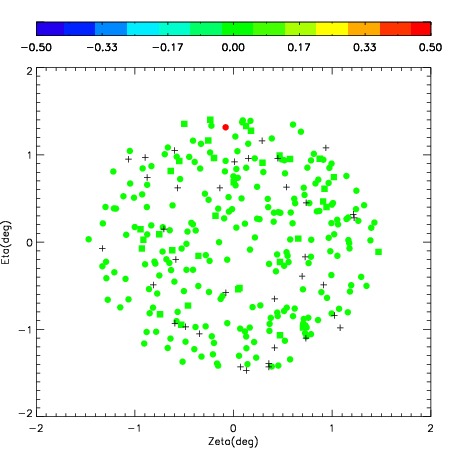

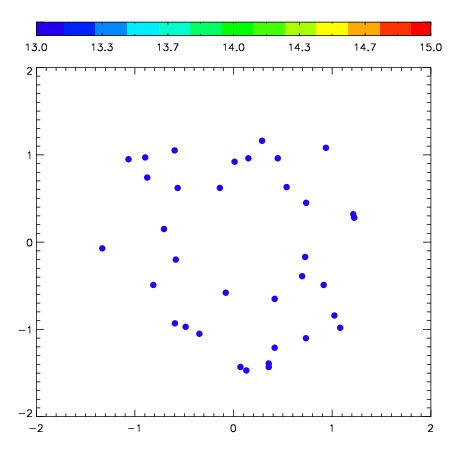
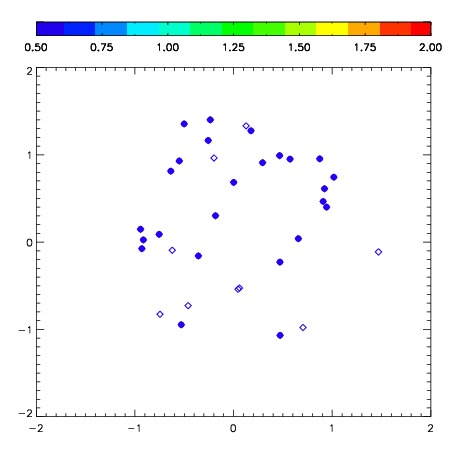
| Frame | Nreads | Zeropoints | Mag plots | Spatial mag deviation | Spatial sky 16325A emission deviations (filled: sky, open: star) | Spatial sky continuum emission | Spatial sky telluric CO2 absorption deviations (filled: H < 10) | |||||||||||||||||||||||
| 0 | 0 |
|
|
|
|
|
|
| IPAIR | NAME | SHIFT | NEWSHIFT | S/N | NAME | SHIFT | NEWSHIFT | S/N |
| 0 | 06100016 | 0.394705 | 0.00000 | 237.691 | 06100017 | -0.00316421 | 0.397869 | 235.791 |
| 1 | 06100015 | 0.386611 | 0.00809398 | 249.545 | 06100014 | 6.67423e-05 | 0.394638 | 248.794 |
| 2 | 06100012 | 0.391647 | 0.00305799 | 249.508 | 06100010 | 0.00000 | 0.394705 | 246.190 |
| 3 | 06100011 | 0.392536 | 0.00216898 | 248.970 | 06100013 | -0.000778049 | 0.395483 | 245.533 |