| Red | Green | Blue | |
| z | 17.64 | ||
| znorm | Inf | ||
| sky | -Inf | -Inf | -Inf |
| S/N | 24.4 | 40.7 | 42.6 |
| S/N(c) | 0.0 | 0.0 | 0.0 |
| SN(E/C) |
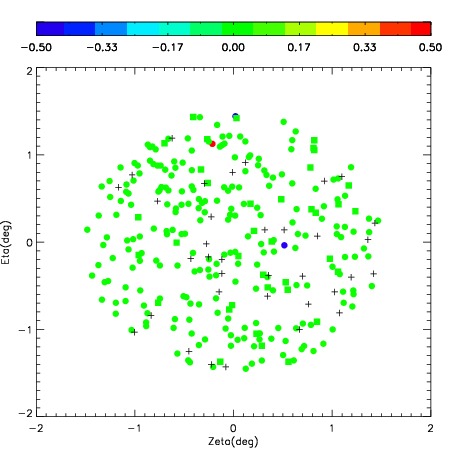


| Frame | Nreads | Zeropoints | Mag plots | Spatial mag deviation | Spatial sky 16325A emission deviations (filled: sky, open: star) | Spatial sky continuum emission | Spatial sky telluric CO2 absorption deviations (filled: H < 10) | |||||||||||||||||||||||
| 0 | 0 |
|
|
|
|
|
|
| IPAIR | NAME | SHIFT | NEWSHIFT | S/N | NAME | SHIFT | NEWSHIFT | S/N |
| 0 | 04880061 | 0.502209 | 0.00000 | 259.117 | 04880066 | 0.0336821 | 0.468527 | 256.617 |
| 1 | 04880060 | 0.492356 | 0.00985301 | 271.045 | 04880059 | 0.00000 | 0.502209 | 263.792 |
| 2 | 04880065 | 0.490596 | 0.0116130 | 264.623 | 04880063 | 0.0364345 | 0.465775 | 262.327 |
| 3 | 04880064 | 0.489891 | 0.0123180 | 261.293 | 04880062 | 0.0344661 | 0.467743 | 260.267 |