| Red | Green | Blue | |
| z | 17.64 | ||
| znorm | Inf | ||
| sky | -Inf | -Inf | -Inf |
| S/N | 25.8 | 42.6 | 45.3 |
| S/N(c) | 0.0 | 0.0 | 0.0 |
| SN(E/C) |
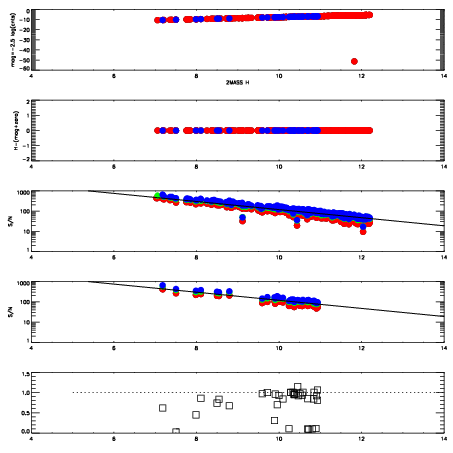
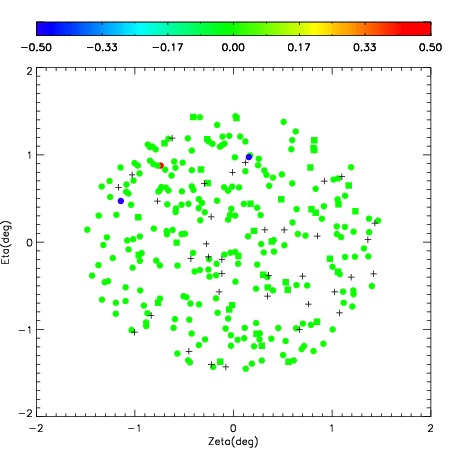
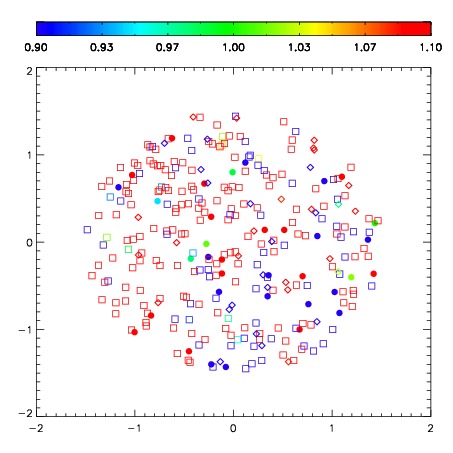


| Frame | Nreads | Zeropoints | Mag plots | Spatial mag deviation | Spatial sky 16325A emission deviations (filled: sky, open: star) | Spatial sky continuum emission | Spatial sky telluric CO2 absorption deviations (filled: H < 10) | |||||||||||||||||||||||
| 0 | 0 |
|
|
|
|
|
|
| IPAIR | NAME | SHIFT | NEWSHIFT | S/N | NAME | SHIFT | NEWSHIFT | S/N |
| 0 | 09770017 | 0.546938 | 0.00000 | 293.815 | 09770018 | 0.0582224 | 0.488716 | 291.538 |
| 1 | 09770021 | 0.542880 | 0.00405800 | 296.473 | 09770019 | 0.0568170 | 0.490121 | 295.034 |
| 2 | 09770020 | 0.532896 | 0.0140420 | 295.476 | 09770022 | 0.0570875 | 0.489850 | 292.729 |
| 3 | 09770016 | 0.541231 | 0.00570703 | 292.355 | 09770015 | 0.00000 | 0.546938 | 0.00000 |