| Red | Green | Blue | |
| z | 17.64 | ||
| znorm | Inf | ||
| sky | -NaN | -Inf | -Inf |
| S/N | 24.9 | 41.0 | 43.7 |
| S/N(c) | 0.0 | 0.0 | 0.0 |
| SN(E/C) |
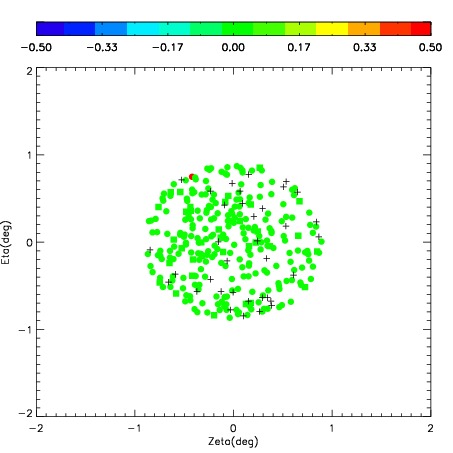
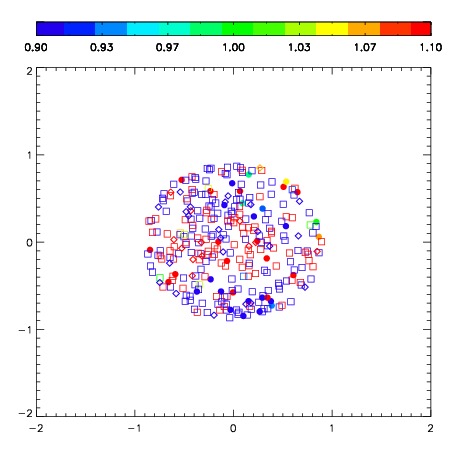
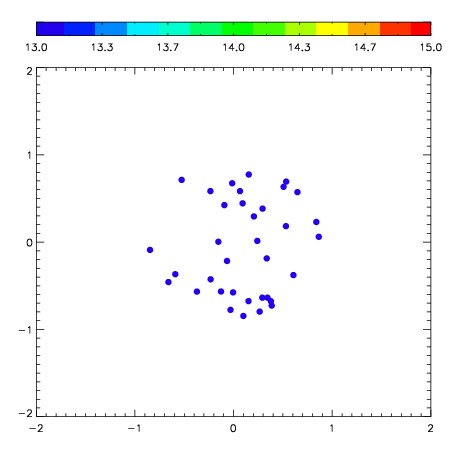

| Frame | Nreads | Zeropoints | Mag plots | Spatial mag deviation | Spatial sky 16325A emission deviations (filled: sky, open: star) | Spatial sky continuum emission | Spatial sky telluric CO2 absorption deviations (filled: H < 10) | |||||||||||||||||||||||
| 0 | 0 |
|
|
|
|
|
|
| IPAIR | NAME | SHIFT | NEWSHIFT | S/N | NAME | SHIFT | NEWSHIFT | S/N |
| 0 | 05240064 | 0.314579 | 0.00000 | 302.436 | 05240066 | -0.0198627 | 0.334442 | 308.102 |
| 1 | 05240068 | 0.313817 | 0.000762016 | 312.136 | 05240063 | 0.00000 | 0.314579 | 312.445 |
| 2 | 05240065 | 0.308642 | 0.00593701 | 307.212 | 05240067 | -0.0205242 | 0.335103 | 311.300 |
| 3 | 05240069 | 0.313416 | 0.00116301 | 296.779 | 05240070 | -0.0198728 | 0.334452 | 287.634 |