| Red | Green | Blue | |
| z | 17.64 | ||
| znorm | Inf | ||
| sky | -Inf | -Inf | -Inf |
| S/N | 22.8 | 38.5 | 42.8 |
| S/N(c) | 0.0 | 0.0 | 0.0 |
| SN(E/C) |

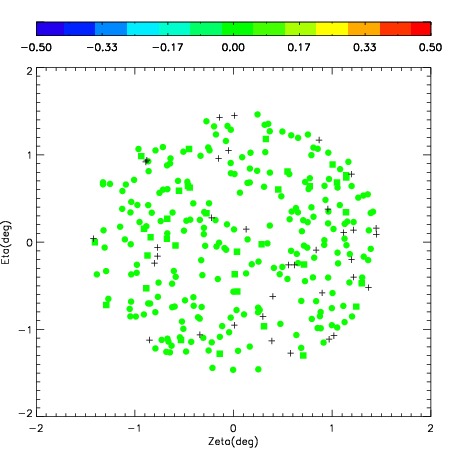


| Frame | Nreads | Zeropoints | Mag plots | Spatial mag deviation | Spatial sky 16325A emission deviations (filled: sky, open: star) | Spatial sky continuum emission | Spatial sky telluric CO2 absorption deviations (filled: H < 10) | |||||||||||||||||||||||
| 0 | 0 |
|
|
|
|
|
|
| IPAIR | NAME | SHIFT | NEWSHIFT | S/N | NAME | SHIFT | NEWSHIFT | S/N |
| 0 | 05480026 | 0.397852 | 0.00000 | 223.430 | 05480025 | 0.00000 | 0.397852 | 206.844 |
| 1 | 05480030 | 0.391481 | 0.00637099 | 244.075 | 05480032 | 0.00145212 | 0.396400 | 252.728 |
| 2 | 05480031 | 0.397249 | 0.000602990 | 242.753 | 05480028 | 0.00535950 | 0.392493 | 235.354 |
| 3 | 05480027 | 0.396555 | 0.00129700 | 227.090 | 05480029 | 0.00144741 | 0.396405 | 233.018 |