| Red | Green | Blue | |
| z | 17.64 | ||
| znorm | Inf | ||
| sky | -Inf | -NaN | -Inf |
| S/N | 25.7 | 44.0 | 47.3 |
| S/N(c) | 0.0 | 0.0 | 0.0 |
| SN(E/C) |


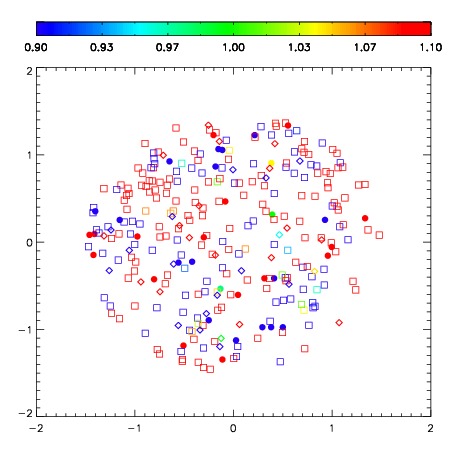


| Frame | Nreads | Zeropoints | Mag plots | Spatial mag deviation | Spatial sky 16325A emission deviations (filled: sky, open: star) | Spatial sky continuum emission | Spatial sky telluric CO2 absorption deviations (filled: H < 10) | |||||||||||||||||||||||
| 0 | 0 |
|
|
|
|
|
|
| IPAIR | NAME | SHIFT | NEWSHIFT | S/N | NAME | SHIFT | NEWSHIFT | S/N |
| 0 | 09990018 | 0.553962 | 0.00000 | 272.129 | 09990013 | 0.00000 | 0.553962 | 271.726 |
| 1 | 09990015 | 0.547264 | 0.00669801 | 281.655 | 09990017 | 0.0566781 | 0.497284 | 288.096 |
| 2 | 09990014 | 0.549369 | 0.00459301 | 274.042 | 09990016 | 0.0567433 | 0.497219 | 284.648 |
| 3 | 09990019 | 0.550403 | 0.00355899 | 271.881 | 09990020 | 0.0606867 | 0.493275 | 268.949 |