| Red | Green | Blue | |
| z | 17.64 | ||
| znorm | Inf | ||
| sky | -NaN | -Inf | -Inf |
| S/N | 22.7 | 37.4 | 40.9 |
| S/N(c) | 0.0 | 0.0 | 0.0 |
| SN(E/C) |


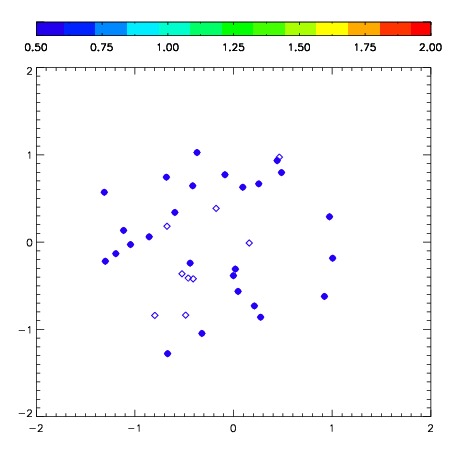
| Frame | Nreads | Zeropoints | Mag plots | Spatial mag deviation | Spatial sky 16325A emission deviations (filled: sky, open: star) | Spatial sky continuum emission | Spatial sky telluric CO2 absorption deviations (filled: H < 10) | |||||||||||||||||||||||
| 0 | 0 |
|
|
|
|
|
|
| IPAIR | NAME | SHIFT | NEWSHIFT | S/N | NAME | SHIFT | NEWSHIFT | S/N |
| 0 | 09040023 | 0.382829 | 0.00000 | 306.929 | 09040029 | 0.0105551 | 0.372274 | 309.532 |
| 1 | 09040027 | 0.376934 | 0.00589502 | 306.174 | 09040025 | 0.00972101 | 0.373108 | 306.068 |
| 2 | 09040024 | 0.370499 | 0.0123300 | 305.852 | 09040022 | 0.00000 | 0.382829 | 304.033 |
| 3 | 09040028 | 0.378019 | 0.00481001 | 288.297 | 09040026 | 0.0108182 | 0.372011 | 297.176 |