| Red | Green | Blue | |
| z | 17.64 | ||
| znorm | Inf | ||
| sky | -Inf | -Inf | -Inf |
| S/N | 25.0 | 42.7 | 46.2 |
| S/N(c) | 0.0 | 0.0 | 0.0 |
| SN(E/C) |

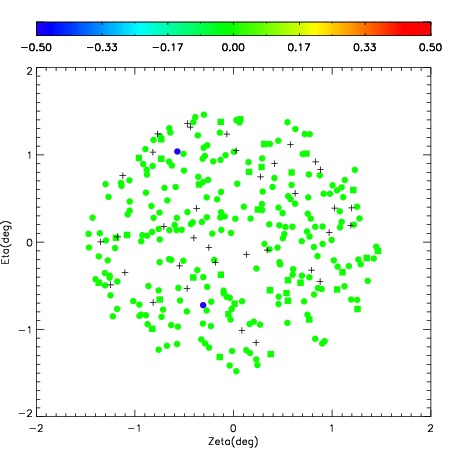


| Frame | Nreads | Zeropoints | Mag plots | Spatial mag deviation | Spatial sky 16325A emission deviations (filled: sky, open: star) | Spatial sky continuum emission | Spatial sky telluric CO2 absorption deviations (filled: H < 10) | |||||||||||||||||||||||
| 0 | 0 |
|
|
|
|
|
|
| IPAIR | NAME | SHIFT | NEWSHIFT | S/N | NAME | SHIFT | NEWSHIFT | S/N |
| 0 | 10070015 | 0.448817 | 0.00000 | 249.104 | 10070013 | 0.00000 | 0.448817 | 250.890 |
| 1 | 10070019 | 0.445790 | 0.00302702 | 253.878 | 10070020 | 0.0622457 | 0.386571 | 252.344 |
| 2 | 10070018 | 0.444788 | 0.00402901 | 250.293 | 10070016 | 0.0657846 | 0.383032 | 250.898 |
| 3 | 10070014 | 0.445986 | 0.00283101 | 246.265 | 10070017 | 0.0619957 | 0.386821 | 241.471 |