| Red | Green | Blue | |
| z | 17.64 | ||
| znorm | Inf | ||
| sky | -NaN | -NaN | -Inf |
| S/N | 22.0 | 38.7 | 39.4 |
| S/N(c) | 0.0 | 0.0 | 0.0 |
| SN(E/C) |

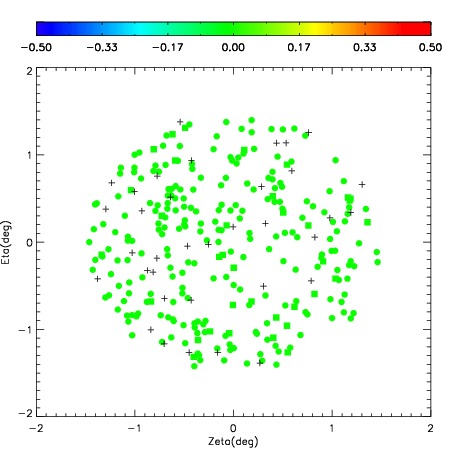
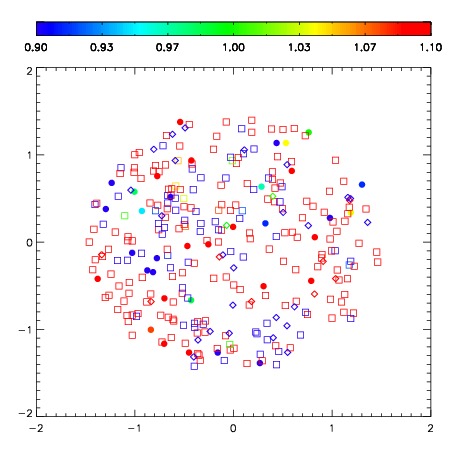

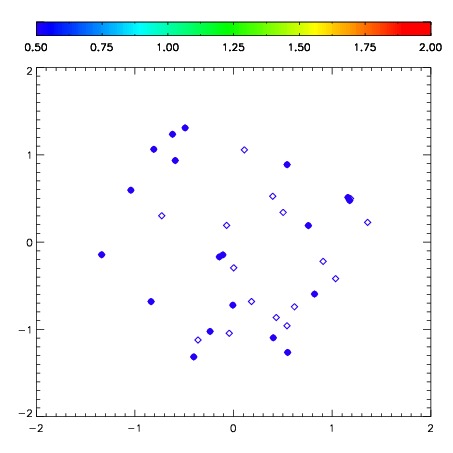
| Frame | Nreads | Zeropoints | Mag plots | Spatial mag deviation | Spatial sky 16325A emission deviations (filled: sky, open: star) | Spatial sky continuum emission | Spatial sky telluric CO2 absorption deviations (filled: H < 10) | |||||||||||||||||||||||
| 0 | 0 |
|
|
|
|
|
|
| IPAIR | NAME | SHIFT | NEWSHIFT | S/N | NAME | SHIFT | NEWSHIFT | S/N |
| 0 | 10090018 | 0.433813 | 0.00000 | 203.824 | 10090016 | 0.0115984 | 0.422215 | 209.098 |
| 1 | 10090017 | 0.427962 | 0.00585100 | 216.444 | 10090012 | 0.00000 | 0.433813 | 217.077 |
| 2 | 10090013 | 0.417759 | 0.0160540 | 204.244 | 10090015 | 0.0111240 | 0.422689 | 215.854 |
| 3 | 10090014 | 0.422670 | 0.0111430 | 197.913 | 10090019 | 0.0167693 | 0.417044 | 189.148 |