| Red | Green | Blue | |
| z | 17.64 | ||
| znorm | Inf | ||
| sky | -NaN | -Inf | -Inf |
| S/N | 25.6 | 41.1 | 44.7 |
| S/N(c) | 0.0 | 0.0 | 0.0 |
| SN(E/C) |

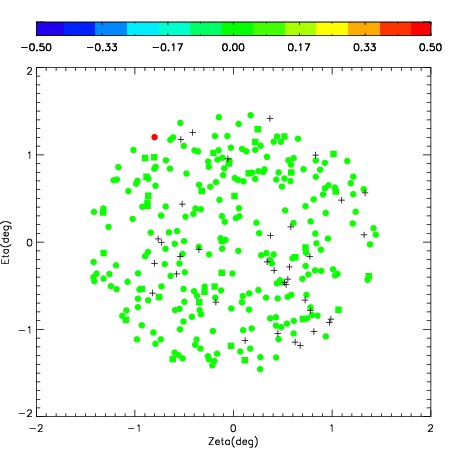
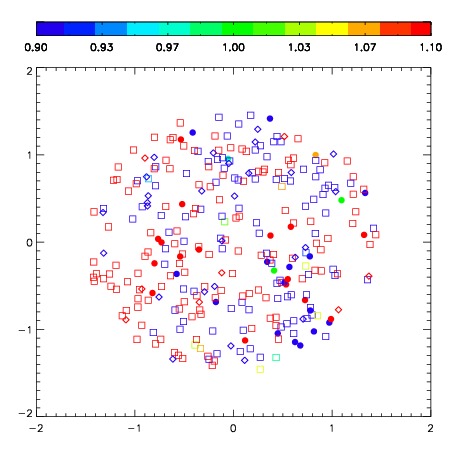

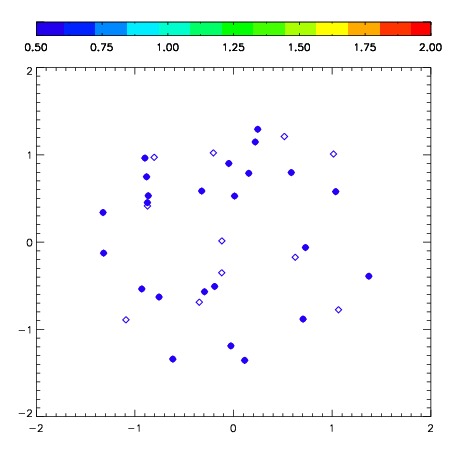
| Frame | Nreads | Zeropoints | Mag plots | Spatial mag deviation | Spatial sky 16325A emission deviations (filled: sky, open: star) | Spatial sky continuum emission | Spatial sky telluric CO2 absorption deviations (filled: H < 10) | |||||||||||||||||||||||
| 0 | 0 |
|
|
|
|
|
|
| IPAIR | NAME | SHIFT | NEWSHIFT | S/N | NAME | SHIFT | NEWSHIFT | S/N |
| 0 | 09070074 | 0.353730 | 0.00000 | 264.099 | 09070072 | 0.00894736 | 0.344783 | 267.054 |
| 1 | 09070071 | 0.336902 | 0.0168280 | 268.338 | 09070073 | 0.0126539 | 0.341076 | 267.474 |
| 2 | 09070070 | 0.338678 | 0.0150520 | 264.081 | 09070069 | 0.00000 | 0.353730 | 265.119 |
| 3 | 09070075 | 0.349458 | 0.00427198 | 260.383 | 09070076 | 0.00793571 | 0.345794 | 260.666 |