| Red | Green | Blue | |
| z | 17.64 | ||
| znorm | Inf | ||
| sky | -Inf | -Inf | -Inf |
| S/N | 26.8 | 44.3 | 46.3 |
| S/N(c) | 0.0 | 0.0 | 0.0 |
| SN(E/C) |

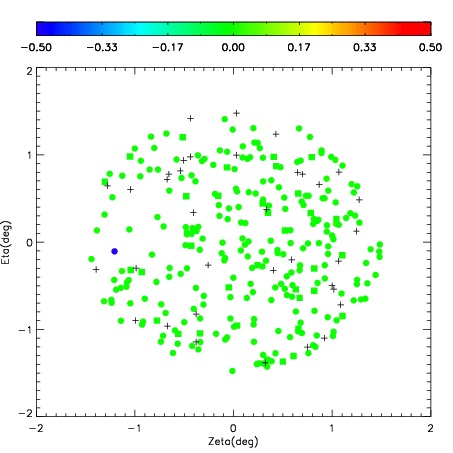
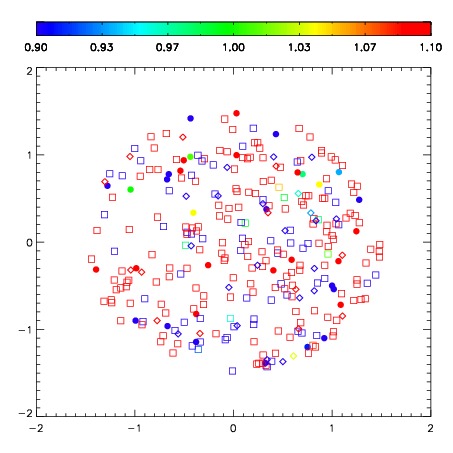


| Frame | Nreads | Zeropoints | Mag plots | Spatial mag deviation | Spatial sky 16325A emission deviations (filled: sky, open: star) | Spatial sky continuum emission | Spatial sky telluric CO2 absorption deviations (filled: H < 10) | |||||||||||||||||||||||
| 0 | 0 |
|
|
|
|
|
|
| IPAIR | NAME | SHIFT | NEWSHIFT | S/N | NAME | SHIFT | NEWSHIFT | S/N |
| 0 | 10410017 | 0.434490 | 0.00000 | 102.944 | 10410015 | 0.0162705 | 0.418220 | 106.479 |
| 1 | 10410013 | 0.420882 | 0.0136080 | 97.2863 | 10410014 | 0.0148111 | 0.419679 | 102.391 |
| 2 | 10410016 | 0.427281 | 0.00720900 | 96.7721 | 10410018 | 0.0163925 | 0.418097 | 96.4613 |
| 3 | 10410012 | 0.429980 | 0.00450999 | 93.2713 | 10410011 | 0.00000 | 0.434490 | 92.4489 |