| Red | Green | Blue | |
| z | 17.64 | ||
| znorm | Inf | ||
| sky | -NaN | -Inf | -Inf |
| S/N | 24.7 | 41.2 | 44.4 |
| S/N(c) | 0.0 | 0.0 | 0.0 |
| SN(E/C) |

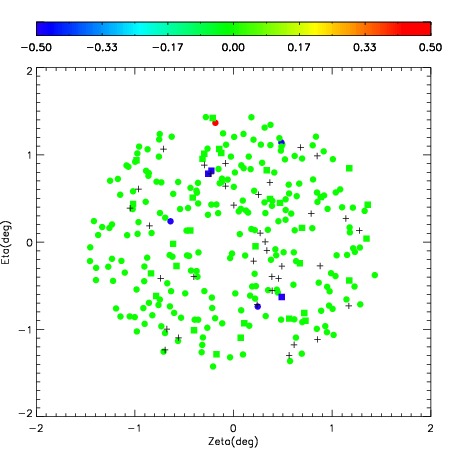
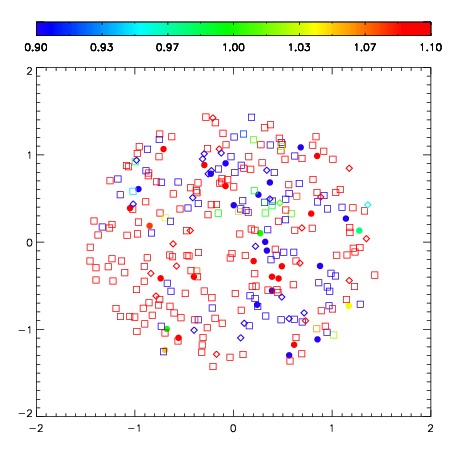
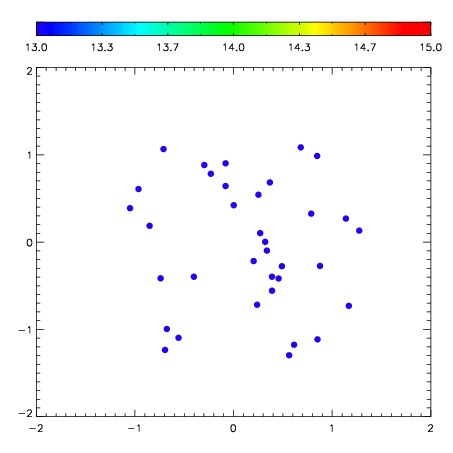
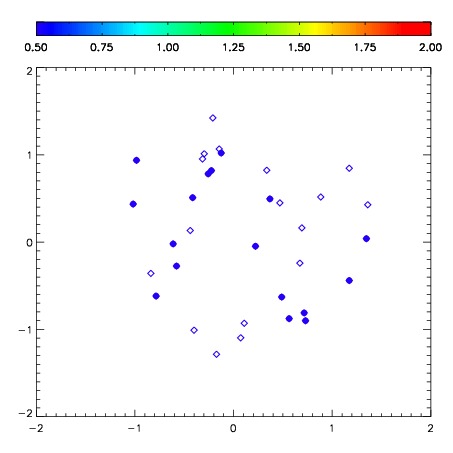
| Frame | Nreads | Zeropoints | Mag plots | Spatial mag deviation | Spatial sky 16325A emission deviations (filled: sky, open: star) | Spatial sky continuum emission | Spatial sky telluric CO2 absorption deviations (filled: H < 10) | |||||||||||||||||||||||
| 0 | 0 |
|
|
|
|
|
|
| IPAIR | NAME | SHIFT | NEWSHIFT | S/N | NAME | SHIFT | NEWSHIFT | S/N |
| 0 | 10490014 | 0.498584 | 0.00000 | 293.326 | 10490017 | 0.0484904 | 0.450094 | 0.00000 |
| 1 | 10490019 | 0.495789 | 0.00279501 | 329.870 | 10490020 | 0.0379941 | 0.460590 | 331.077 |
| 2 | 10490015 | 0.498078 | 0.000506014 | 309.958 | 10490013 | 0.00000 | 0.498584 | 302.620 |
| 3 | 10490018 | 0.496421 | 0.00216299 | 308.596 | 10490016 | 0.0466986 | 0.451885 | 268.173 |