| Red | Green | Blue | |
| z | 17.64 | ||
| znorm | Inf | ||
| sky | -NaN | -NaN | -Inf |
| S/N | 25.2 | 41.7 | 44.4 |
| S/N(c) | 0.0 | 0.0 | 0.0 |
| SN(E/C) |

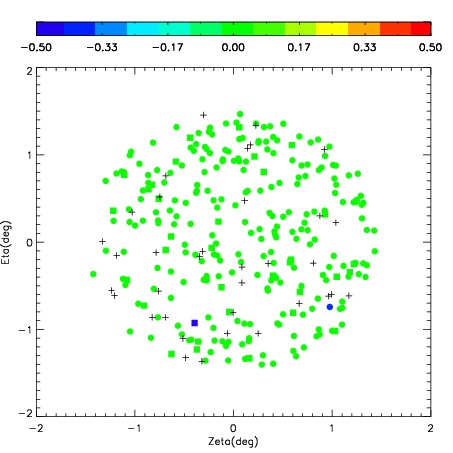

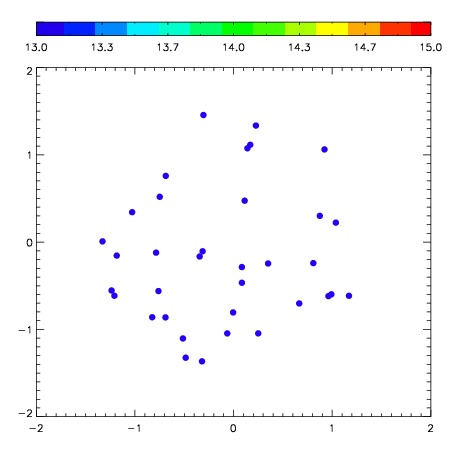
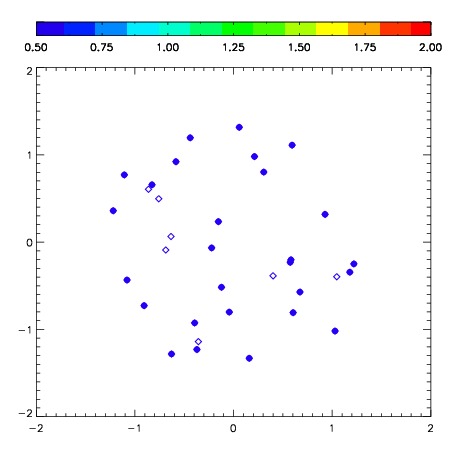
| Frame | Nreads | Zeropoints | Mag plots | Spatial mag deviation | Spatial sky 16325A emission deviations (filled: sky, open: star) | Spatial sky continuum emission | Spatial sky telluric CO2 absorption deviations (filled: H < 10) | |||||||||||||||||||||||
| 0 | 0 |
|
|
|
|
|
|
| IPAIR | NAME | SHIFT | NEWSHIFT | S/N | NAME | SHIFT | NEWSHIFT | S/N |
| 0 | 06690017 | 0.505112 | 0.00000 | 273.431 | 06690011 | 0.00000 | 0.505112 | 266.846 |
| 1 | 06690016 | 0.501456 | 0.00365597 | 277.693 | 06690018 | 0.0506937 | 0.454418 | 276.955 |
| 2 | 06690013 | 0.498753 | 0.00635898 | 272.151 | 06690015 | 0.0490642 | 0.456048 | 263.441 |
| 3 | 06690012 | 0.497422 | 0.00768998 | 262.542 | 06690014 | 0.0511985 | 0.453913 | 262.113 |