| Red | Green | Blue | |
| z | 17.64 | ||
| znorm | Inf | ||
| sky | -NaN | -NaN | -Inf |
| S/N | 26.8 | 43.4 | 47.0 |
| S/N(c) | 0.0 | 0.0 | 0.0 |
| SN(E/C) |
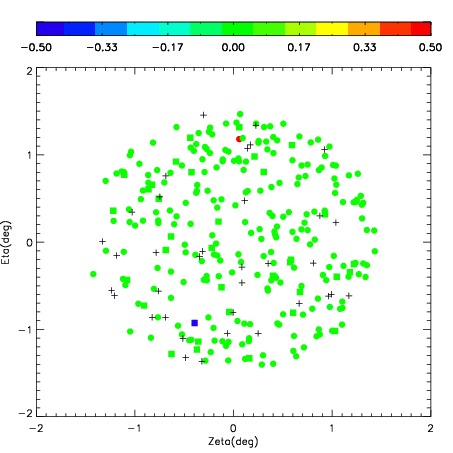
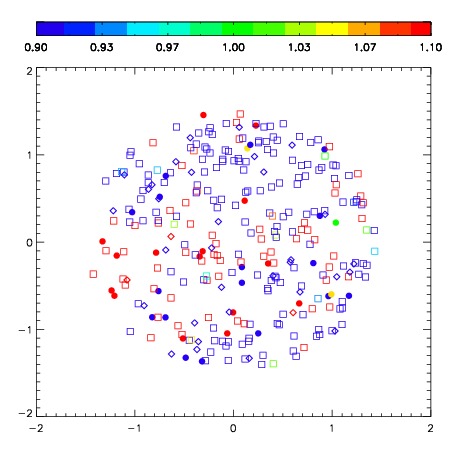

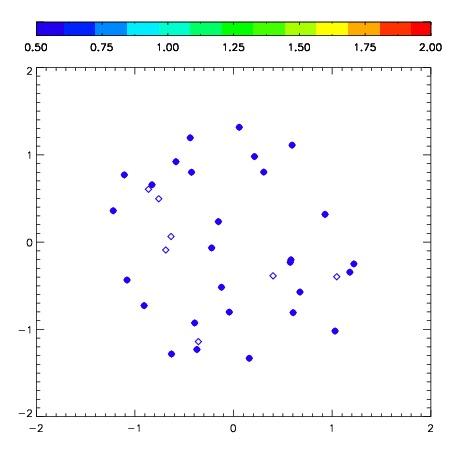
| Frame | Nreads | Zeropoints | Mag plots | Spatial mag deviation | Spatial sky 16325A emission deviations (filled: sky, open: star) | Spatial sky continuum emission | Spatial sky telluric CO2 absorption deviations (filled: H < 10) | |||||||||||||||||||||||
| 0 | 0 |
|
|
|
|
|
|
| IPAIR | NAME | SHIFT | NEWSHIFT | S/N | NAME | SHIFT | NEWSHIFT | S/N |
| 0 | 08780053 | 0.405895 | 0.00000 | 323.845 | 08780059 | 0.000918388 | 0.404977 | 325.241 |
| 1 | 08780054 | 0.400442 | 0.00545299 | 322.812 | 08780055 | 0.00451967 | 0.401375 | 323.795 |
| 2 | 08780057 | 0.391353 | 0.0145420 | 321.241 | 08780056 | 0.00420290 | 0.401692 | 323.534 |
| 3 | 08780058 | 0.383108 | 0.0227870 | 320.977 | 08780052 | 0.00000 | 0.405895 | 320.407 |