| Red | Green | Blue | |
| z | 17.64 | ||
| znorm | Inf | ||
| sky | -Inf | -Inf | -Inf |
| S/N | 26.0 | 42.6 | 44.8 |
| S/N(c) | 0.0 | 0.0 | 0.0 |
| SN(E/C) |

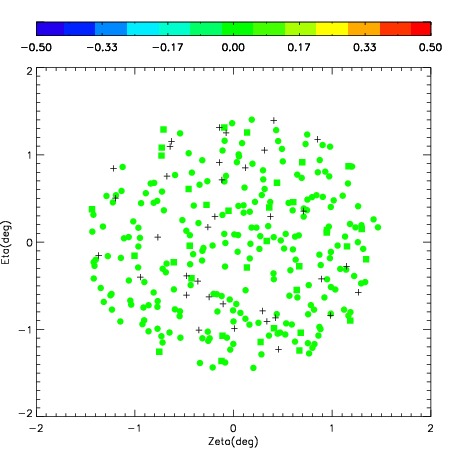
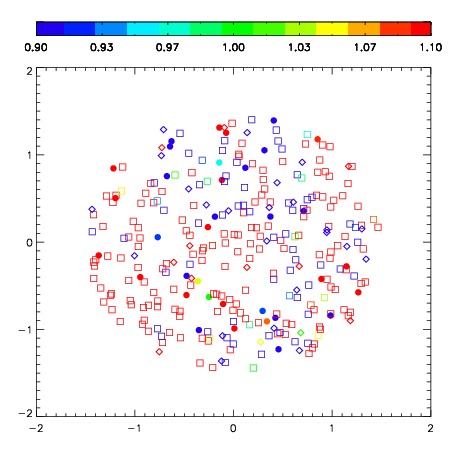

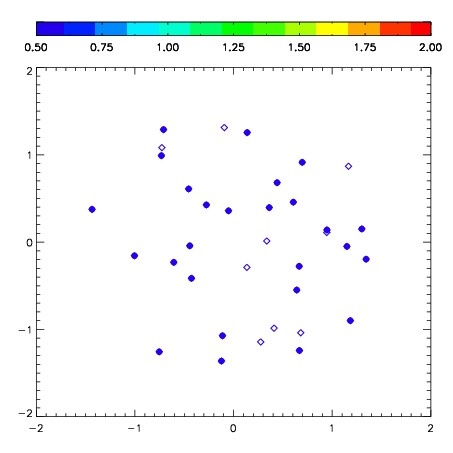
| Frame | Nreads | Zeropoints | Mag plots | Spatial mag deviation | Spatial sky 16325A emission deviations (filled: sky, open: star) | Spatial sky continuum emission | Spatial sky telluric CO2 absorption deviations (filled: H < 10) | |||||||||||||||||||||||
| 0 | 0 |
|
|
|
|
|
|
| IPAIR | NAME | SHIFT | NEWSHIFT | S/N | NAME | SHIFT | NEWSHIFT | S/N |
| 0 | 06680016 | 0.366193 | 0.00000 | 317.614 | 06680017 | -0.0109875 | 0.377180 | 316.665 |
| 1 | 06680015 | 0.362875 | 0.00331798 | 313.721 | 06680014 | -0.0148121 | 0.381005 | 309.697 |
| 2 | 06680012 | 0.362836 | 0.00335699 | 308.463 | 06680013 | -0.0154055 | 0.381599 | 306.761 |
| 3 | 06680011 | 0.363185 | 0.00300801 | 306.182 | 06680010 | 0.00000 | 0.366193 | 296.450 |