| Red | Green | Blue | |
| z | 17.64 | ||
| znorm | Inf | ||
| sky | -Inf | -Inf | -Inf |
| S/N | 26.0 | 43.4 | 43.4 |
| S/N(c) | 0.0 | 0.0 | 0.0 |
| SN(E/C) |
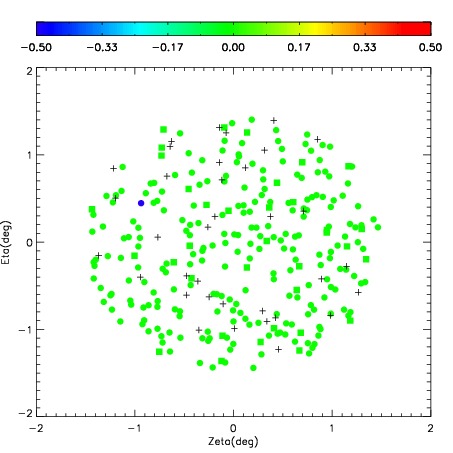
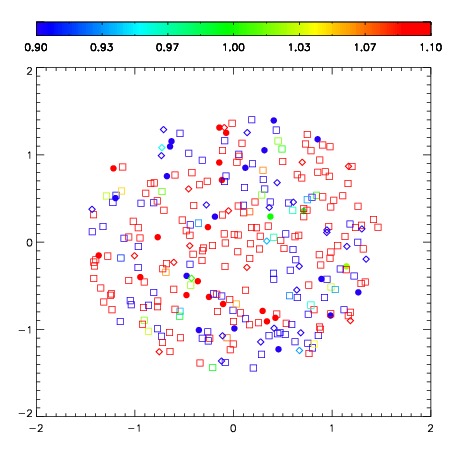
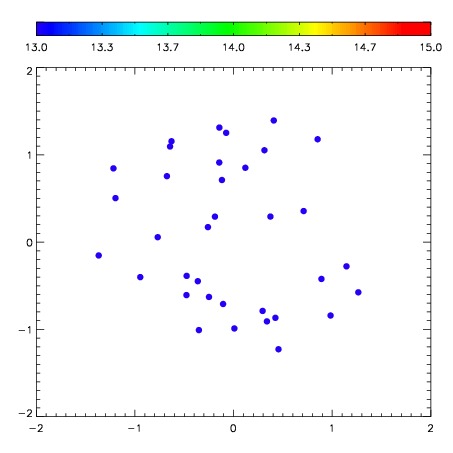
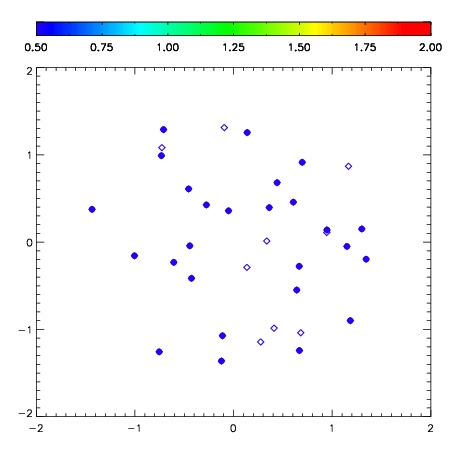
| Frame | Nreads | Zeropoints | Mag plots | Spatial mag deviation | Spatial sky 16325A emission deviations (filled: sky, open: star) | Spatial sky continuum emission | Spatial sky telluric CO2 absorption deviations (filled: H < 10) | |||||||||||||||||||||||
| 0 | 0 |
|
|
|
|
|
|
| IPAIR | NAME | SHIFT | NEWSHIFT | S/N | NAME | SHIFT | NEWSHIFT | S/N |
| 0 | 10040016 | 0.474689 | 0.00000 | 281.155 | 10040011 | 0.00000 | 0.474689 | 277.574 |
| 1 | 10040013 | 0.474592 | 9.70066e-05 | 272.908 | 10040018 | 0.0518109 | 0.422878 | 274.461 |
| 2 | 10040017 | 0.473930 | 0.000759006 | 269.233 | 10040014 | 0.0527078 | 0.421981 | 269.156 |
| 3 | 10040012 | 0.474313 | 0.000376016 | 262.828 | 10040015 | 0.0517993 | 0.422890 | 266.598 |