| Red | Green | Blue | |
| z | 17.64 | ||
| znorm | Inf | ||
| sky | -NaN | -Inf | -Inf |
| S/N | 26.4 | 44.0 | 46.6 |
| S/N(c) | 0.0 | 0.0 | 0.0 |
| SN(E/C) |

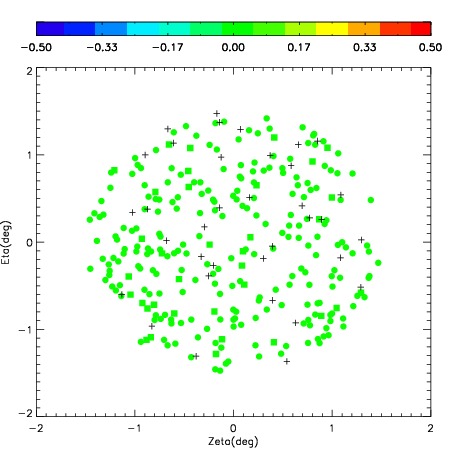


| Frame | Nreads | Zeropoints | Mag plots | Spatial mag deviation | Spatial sky 16325A emission deviations (filled: sky, open: star) | Spatial sky continuum emission | Spatial sky telluric CO2 absorption deviations (filled: H < 10) | |||||||||||||||||||||||
| 0 | 0 |
|
|
|
|
|
|
| IPAIR | NAME | SHIFT | NEWSHIFT | S/N | NAME | SHIFT | NEWSHIFT | S/N |
| 0 | 06670017 | 0.390061 | 0.00000 | 183.615 | 06670018 | 0.00388120 | 0.386180 | 183.025 |
| 1 | 06670012 | 0.388073 | 0.00198799 | 206.191 | 06670011 | 0.00000 | 0.390061 | 205.115 |
| 2 | 06670013 | 0.388142 | 0.00191900 | 202.524 | 06670014 | -0.00139466 | 0.391456 | 203.334 |
| 3 | 06670016 | 0.389353 | 0.000707984 | 192.636 | 06670015 | -0.00401893 | 0.394080 | 196.279 |