| Red | Green | Blue | |
| z | 17.64 | ||
| znorm | Inf | ||
| sky | -Inf | -Inf | -Inf |
| S/N | 25.4 | 42.0 | 44.5 |
| S/N(c) | 0.0 | 0.0 | 0.0 |
| SN(E/C) |

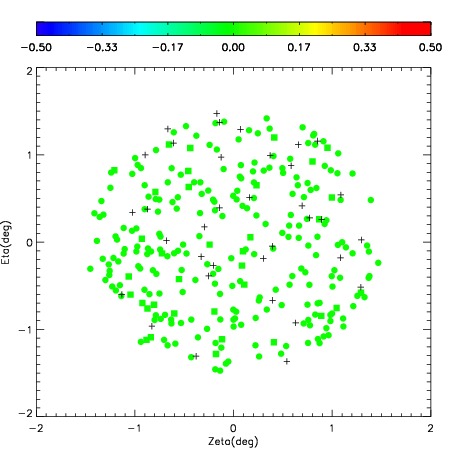
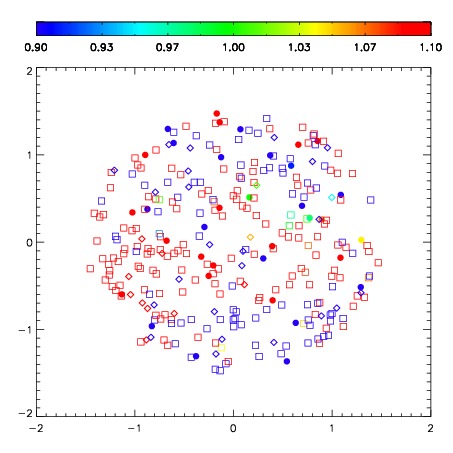


| Frame | Nreads | Zeropoints | Mag plots | Spatial mag deviation | Spatial sky 16325A emission deviations (filled: sky, open: star) | Spatial sky continuum emission | Spatial sky telluric CO2 absorption deviations (filled: H < 10) | |||||||||||||||||||||||
| 0 | 0 |
|
|
|
|
|
|
| IPAIR | NAME | SHIFT | NEWSHIFT | S/N | NAME | SHIFT | NEWSHIFT | S/N |
| 0 | 10100014 | 0.360505 | 0.00000 | 199.450 | 10100015 | 0.000134259 | 0.360371 | 201.329 |
| 1 | 10100018 | 0.351573 | 0.00893202 | 212.889 | 10100019 | 0.00500238 | 0.355503 | 212.131 |
| 2 | 10100013 | 0.354744 | 0.00576103 | 210.269 | 10100012 | 0.00000 | 0.360505 | 204.368 |
| 3 | 10100017 | 0.356437 | 0.00406802 | 207.959 | 10100016 | 0.00264922 | 0.357856 | 202.040 |