| Red | Green | Blue | |
| z | 17.64 | ||
| znorm | Inf | ||
| sky | -Inf | -Inf | -Inf |
| S/N | 27.8 | 47.2 | 50.1 |
| S/N(c) | 0.0 | 0.0 | 0.0 |
| SN(E/C) |
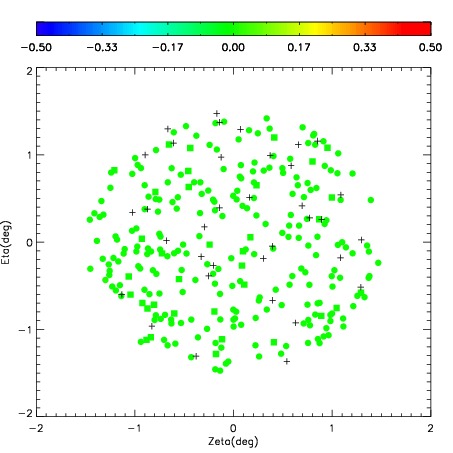
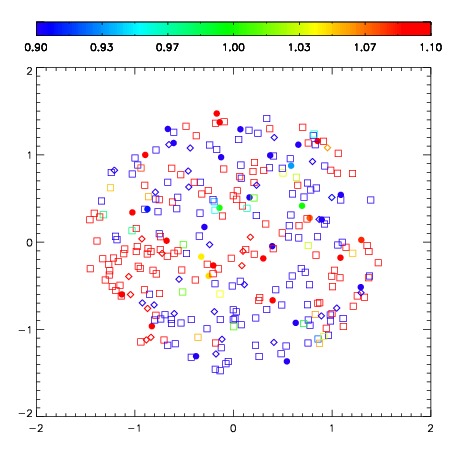
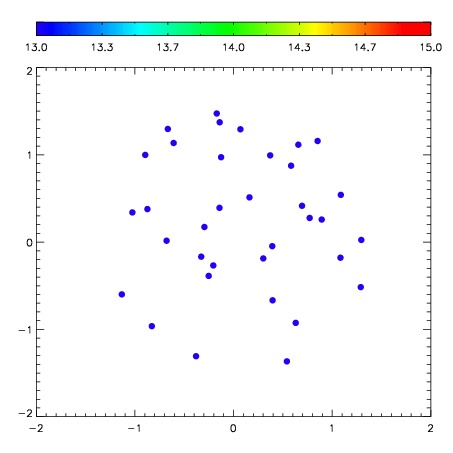
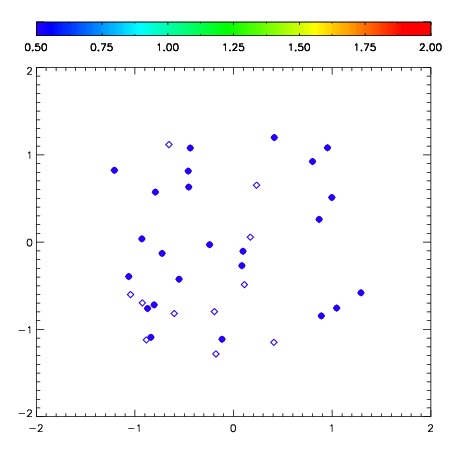
| Frame | Nreads | Zeropoints | Mag plots | Spatial mag deviation | Spatial sky 16325A emission deviations (filled: sky, open: star) | Spatial sky continuum emission | Spatial sky telluric CO2 absorption deviations (filled: H < 10) | |||||||||||||||||||||||
| 0 | 0 |
|
|
|
|
|
|
| IPAIR | NAME | SHIFT | NEWSHIFT | S/N | NAME | SHIFT | NEWSHIFT | S/N |
| 0 | 10160015 | 0.487754 | 0.00000 | 197.850 | 10160020 | 0.0301809 | 0.457573 | 206.366 |
| 1 | 10160018 | 0.482146 | 0.00560799 | 213.912 | 10160017 | 0.0282337 | 0.459520 | 209.923 |
| 2 | 10160019 | 0.478697 | 0.00905699 | 207.861 | 10160016 | 0.0316760 | 0.456078 | 208.983 |
| 3 | 10160014 | 0.485260 | 0.00249398 | 193.439 | 10160013 | 0.00000 | 0.487754 | 195.939 |