| Red | Green | Blue | |
| z | 17.64 | ||
| znorm | Inf | ||
| sky | -Inf | -Inf | -Inf |
| S/N | 29.2 | 48.4 | 51.8 |
| S/N(c) | 0.0 | 0.0 | 0.0 |
| SN(E/C) |

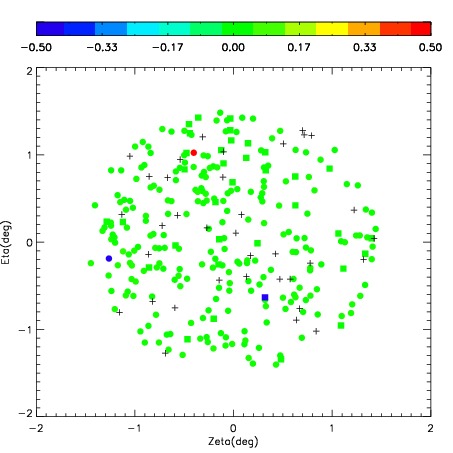
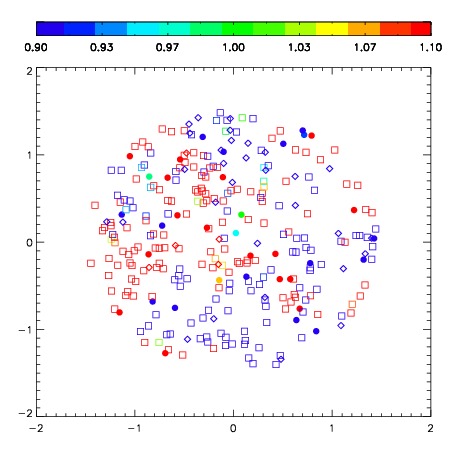
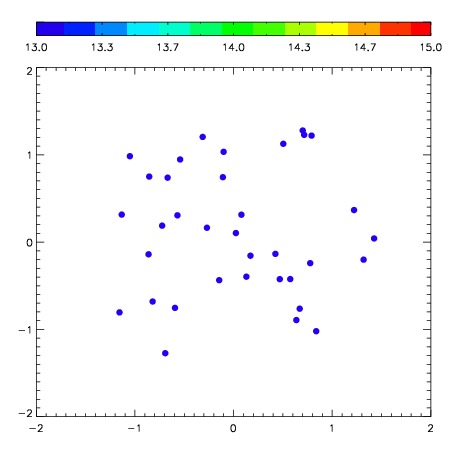

| Frame | Nreads | Zeropoints | Mag plots | Spatial mag deviation | Spatial sky 16325A emission deviations (filled: sky, open: star) | Spatial sky continuum emission | Spatial sky telluric CO2 absorption deviations (filled: H < 10) | |||||||||||||||||||||||
| 0 | 0 |
|
|
|
|
|
|
| IPAIR | NAME | SHIFT | NEWSHIFT | S/N | NAME | SHIFT | NEWSHIFT | S/N |
| 0 | 06680037 | 0.334838 | 0.00000 | 300.449 | 06680039 | -0.000494123 | 0.335332 | 297.709 |
| 1 | 06680034 | 0.330254 | 0.00458401 | 305.451 | 06680035 | -0.00172544 | 0.336563 | 305.250 |
| 2 | 06680033 | 0.328749 | 0.00608900 | 302.284 | 06680036 | 0.00161710 | 0.333221 | 303.176 |
| 3 | 06680038 | 0.330495 | 0.00434300 | 301.847 | 06680032 | 0.00000 | 0.334838 | 298.489 |