| Red | Green | Blue | |
| z | 17.64 | ||
| znorm | Inf | ||
| sky | -Inf | -Inf | -Inf |
| S/N | 15.9 | 27.9 | 29.1 |
| S/N(c) | 0.0 | 0.0 | 0.0 |
| SN(E/C) |


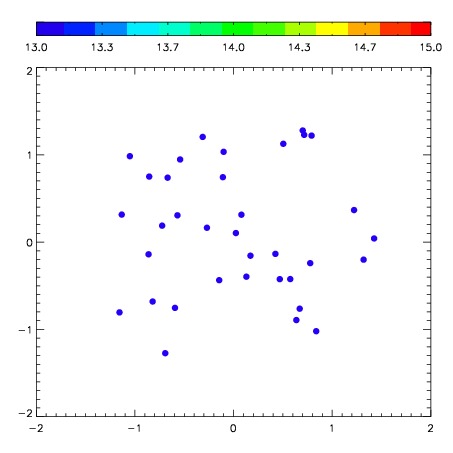

| Frame | Nreads | Zeropoints | Mag plots | Spatial mag deviation | Spatial sky 16325A emission deviations (filled: sky, open: star) | Spatial sky continuum emission | Spatial sky telluric CO2 absorption deviations (filled: H < 10) | |||||||||||||||||||||||
| 0 | 0 |
|
|
|
|
|
|
| IPAIR | NAME | SHIFT | NEWSHIFT | S/N | NAME | SHIFT | NEWSHIFT | S/N |
| 0 | 09170012 | 0.488437 | 0.00000 | 156.454 | 09170015 | 0.0515645 | 0.436872 | 210.884 |
| 1 | 09170016 | 0.460737 | 0.0277000 | 253.987 | 09170011 | 0.00000 | 0.488437 | 236.948 |
| 2 | 09170013 | 0.481748 | 0.00668898 | 150.214 | 09170014 | 0.0428275 | 0.445610 | 170.160 |