| Red | Green | Blue | |
| z | 17.64 | ||
| znorm | Inf | ||
| sky | -NaN | -Inf | -Inf |
| S/N | 26.5 | 44.8 | 47.0 |
| S/N(c) | 0.0 | 0.0 | 0.0 |
| SN(E/C) |

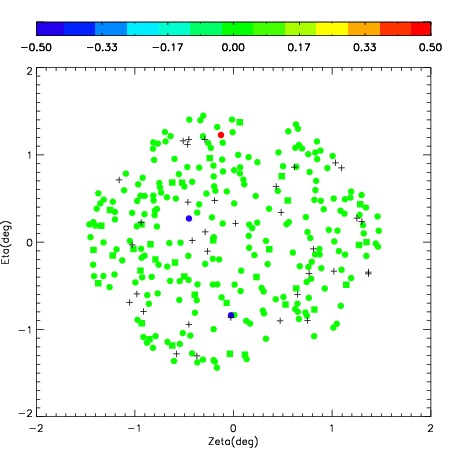


| Frame | Nreads | Zeropoints | Mag plots | Spatial mag deviation | Spatial sky 16325A emission deviations (filled: sky, open: star) | Spatial sky continuum emission | Spatial sky telluric CO2 absorption deviations (filled: H < 10) | |||||||||||||||||||||||
| 0 | 0 |
|
|
|
|
|
|
| IPAIR | NAME | SHIFT | NEWSHIFT | S/N | NAME | SHIFT | NEWSHIFT | S/N |
| 0 | 06980016 | 0.420077 | 0.00000 | 242.378 | 06980011 | 0.00000 | 0.420077 | 238.680 |
| 1 | 06980012 | 0.415291 | 0.00478598 | 245.748 | 06980014 | -0.00136209 | 0.421439 | 247.728 |
| 2 | 06980013 | 0.412530 | 0.00754699 | 245.088 | 06980015 | 0.00446136 | 0.415616 | 244.013 |
| 3 | 06980017 | 0.417872 | 0.00220498 | 243.634 | 06980018 | 0.00266023 | 0.417417 | 242.311 |