| Red | Green | Blue | |
| z | 17.64 | ||
| znorm | Inf | ||
| sky | -NaN | -Inf | -Inf |
| S/N | 27.8 | 46.1 | 50.7 |
| S/N(c) | 0.0 | 0.0 | 0.0 |
| SN(E/C) |

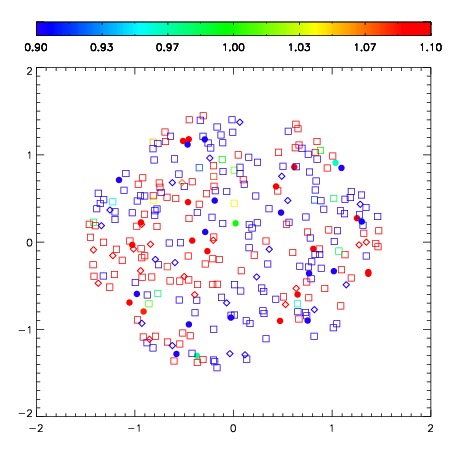


| Frame | Nreads | Zeropoints | Mag plots | Spatial mag deviation | Spatial sky 16325A emission deviations (filled: sky, open: star) | Spatial sky continuum emission | Spatial sky telluric CO2 absorption deviations (filled: H < 10) | |||||||||||||||||||||||
| 0 | 0 |
|
|
|
|
|
|
| IPAIR | NAME | SHIFT | NEWSHIFT | S/N | NAME | SHIFT | NEWSHIFT | S/N |
| 0 | 10260031 | 0.471527 | 0.00000 | 237.850 | 10260032 | 0.0201580 | 0.451369 | 234.104 |
| 1 | 10260027 | 0.444423 | 0.0271040 | 249.784 | 10260028 | 0.0191275 | 0.452400 | 244.130 |
| 2 | 10260030 | 0.464135 | 0.00739202 | 239.827 | 10260025 | 0.00000 | 0.471527 | 240.184 |
| 3 | 10260026 | 0.451924 | 0.0196030 | 238.991 | 10260029 | 0.0195032 | 0.452024 | 234.618 |